
This blog continues the series on TN School Letter Grade data. You can find the main analysis post here. The same dataset applies.
Having looked at the preliminary results of the 2024-25 statewide school letter grade data, I wanted to use machine learning to explore a specific question: how well can we predict a school's letter grade using only demographic characteristics of the student population?
What is Machine Learning?
Machine learning is an AI approach to data that allows the computer to learn insights about the data to become more accurate at predicting outcomes without being programmed to do so. It spots patterns in data, and the more data it's exposed to, the better it does.
The Question
The letter grade formula uses achievement scores (50%), growth scores (40%), and for high schools, college/career readiness rates (10%). These are the inputs that directly calculate the grade. But what if we ignored those inputs entirely and asked: can we predict a school's letter grade knowing only who attends the school?
To answer this, I built models using only demographic features:
Economically disadvantaged percentage
Limited English proficient percentage
Black, Hispanic, Native American percentage
African American percentage
Asian percentage
Hispanic percentage
White percentage
Students with disabilities percentage
Homeless percentage
Foster percentage
Migrant percentage
Military percentage
These 13 features describe the student population but are not part of the letter grade calculation.
Unsupervised Learning: K-Means Clustering
Before building predictive models, I used K-means clustering to identify natural groupings of schools based on three key demographic variables: economically disadvantaged percentage, BHN percentage, and students with disabilities percentage.
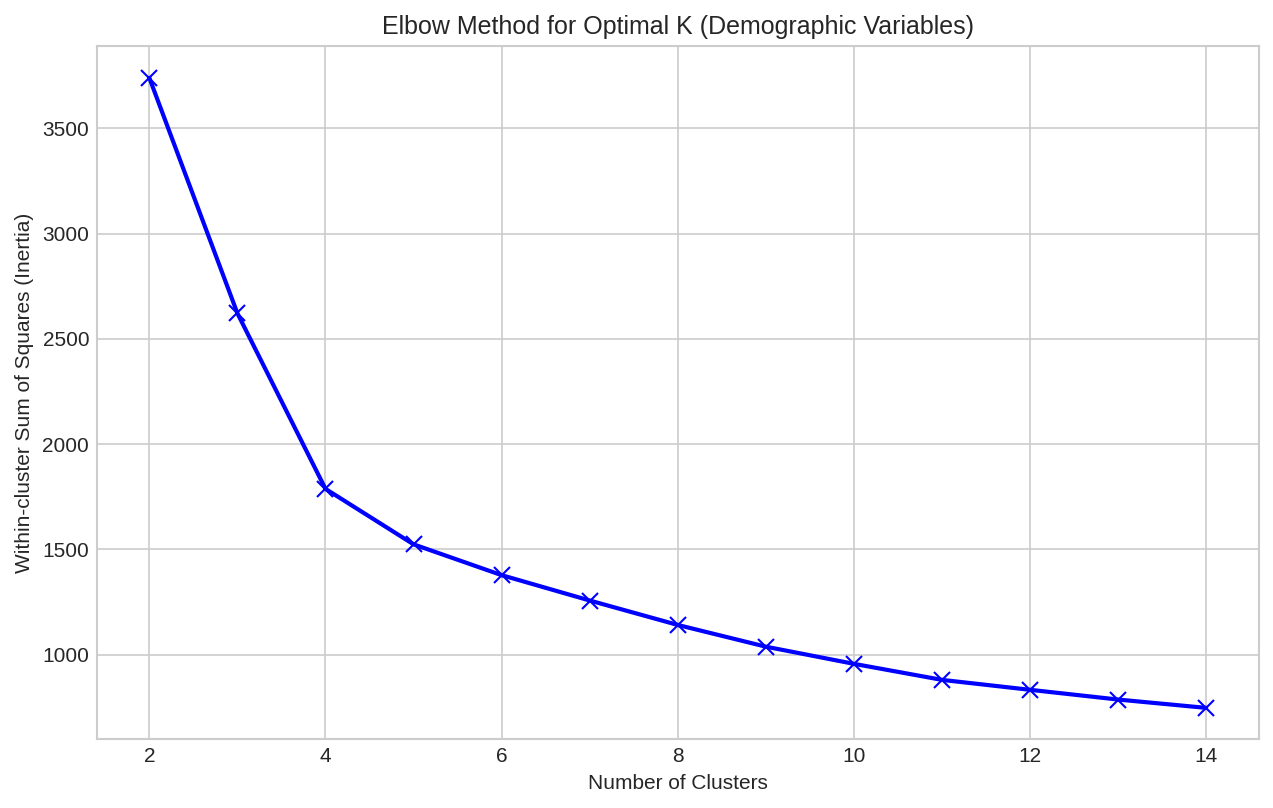
Elbow Method
Using the elbow method, I determined that 5 clusters provided a good balance between simplicity and explanatory power.
Cluster Profiles
| Cluster | ED % | BHN % | SWD % | Schools | Description |
|---|---|---|---|---|---|
| 0 | 23.4% | 17.4% | 17.6% | 535 | Low-poverty, moderate SWD |
| 1 | 36.4% | 14.4% | 25.7% | 249 | Moderate poverty, high SWD |
| 2 | 40.0% | 74.1% | 16.1% | 325 | Moderate poverty, high diversity |
| 3 | 64.6% | 3.9% | 12.8% | 224 | High poverty, rural |
| 4 | 13.6% | 24.4% | 10.5% | 364 | Low poverty, low SWD |
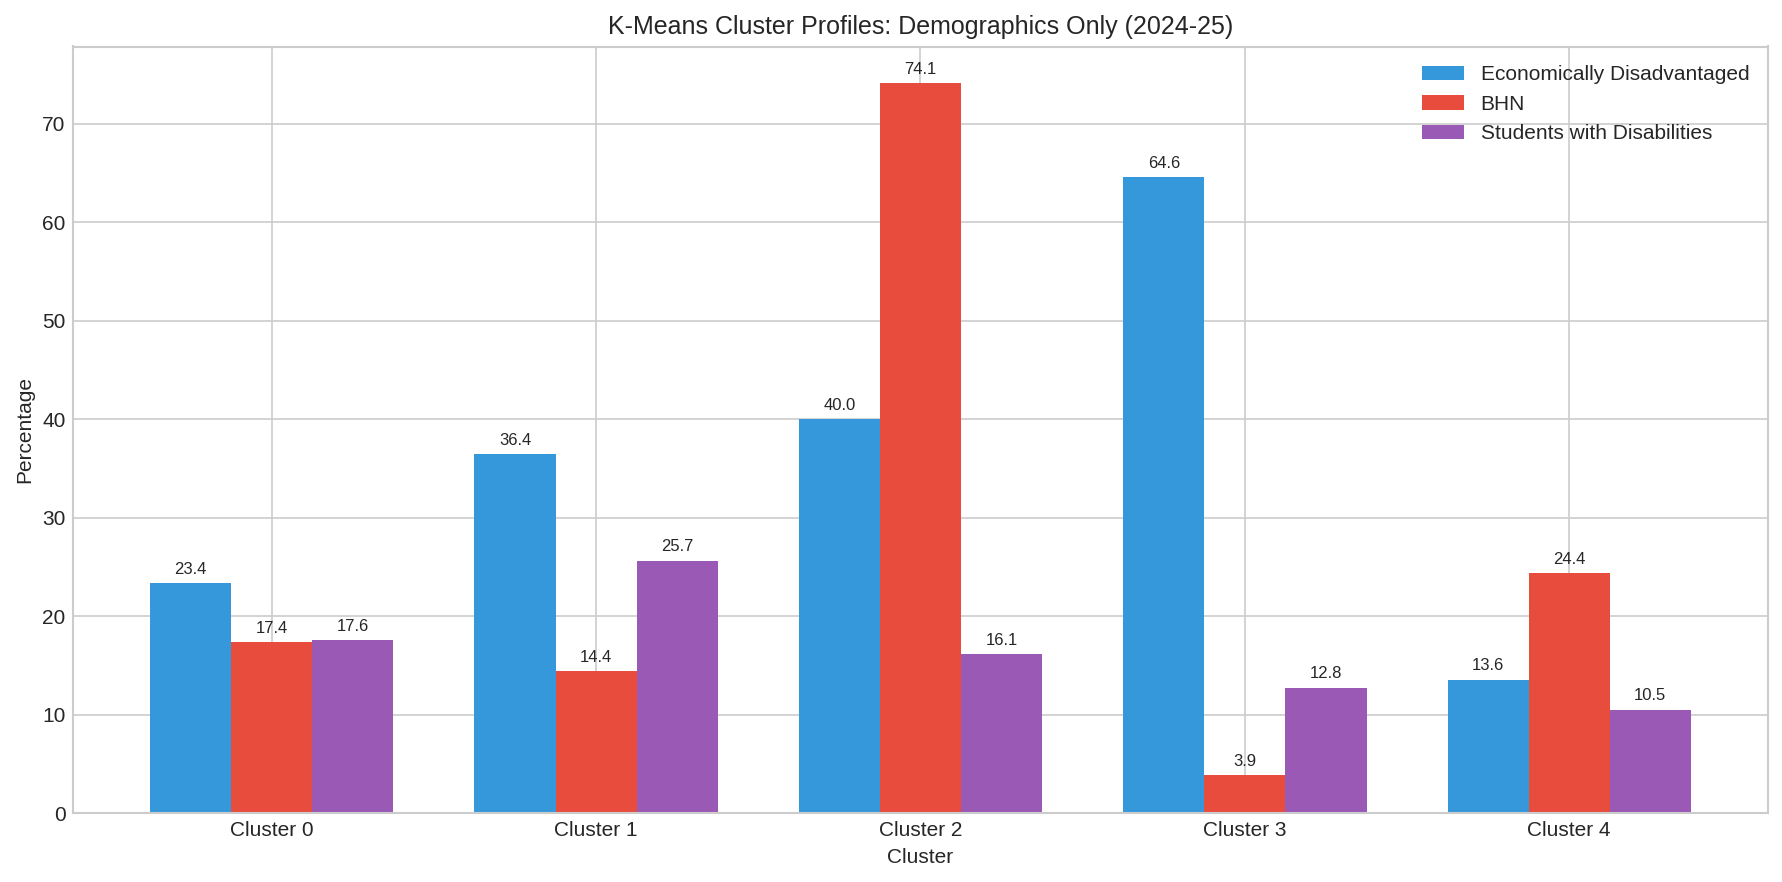
Cluster Profiles
Letter Grades by Cluster
Here's the key finding: letter grades are not randomly distributed across these demographic clusters.
| Cluster | A | B | C | D | F |
|---|---|---|---|---|---|
| 0 (Low poverty, mod SWD) | 25.2% | 31.4% | 29.3% | 13.3% | 0.7% |
| 1 (Mod poverty, high SWD) | 12.0% | 33.3% | 32.9% | 20.9% | 0.8% |
| 2 (Mod poverty, high diversity) | 8.0% | 22.5% | 32.6% | 28.9% | 8.0% |
| 3 (High poverty, rural) | 5.8% | 21.0% | 32.6% | 26.3% | 14.3% |
| 4 (Low poverty, low SWD) | 41.5% | 30.8% | 20.1% | 7.1% | 0.5% |
Cluster 4 (low poverty, low SWD) has 41.5% A grades and almost no F grades. Cluster 3 (high poverty, rural) has only 5.8% A grades and 14.3% F grades. The demographics of who attends a school are strongly associated with what grade that school receives.
Supervised Learning: Predicting Letter Grades
Logistic Regression
I used logistic regression to understand which demographic features most strongly predict each letter grade.
For a letter grade of A, the coefficients were:
| Feature | Coefficient |
|---|---|
| asian_pct | +0.39 |
| hispanic_pct | +0.25 |
| white_pct | +0.22 |
| military_pct | +0.11 |
| ... | ... |
| students_with_disabilities_pct | -0.16 |
| homeless_pct | -0.45 |
| limited_english_proficient_pct | -0.46 |
| economically_disadvantaged_pct | -0.85 |
The strongest predictor of NOT receiving an A is the percentage of economically disadvantaged students (-0.85).
For a letter grade of F, the pattern flips:
| Feature | Coefficient |
|---|---|
| economically_disadvantaged_pct | +1.30 |
| limited_english_proficient_pct | +0.73 |
| black_hispanic_native_american_pct | +0.25 |
| homeless_pct | +0.20 |
| ... | ... |
| military_pct | -0.27 |
| hispanic_pct | -0.57 |
The strongest predictor of receiving an F is the percentage of economically disadvantaged students (+1.30).
Comparing Models
I tested three algorithms to find the best overall predictor:
| Model | Accuracy | Precision | Recall | F1 Score |
|---|---|---|---|---|
| Decision Tree | 28.0% | 28.0% | 28.0% | 28.0% |
| Random Forest | 32.9% | 32.8% | 32.9% | 32.7% |
| Gradient Boosting | 32.5% | 33.4% | 32.5% | 32.6% |
The accuracy is around 33%, which is only slightly better than random guessing (20% for 5 letter grade categories). This tells us something important: demographics alone do not determine a school's letter grade. There is substantial variation in outcomes among schools with similar demographics.
Gradient Boosting Feature Importance
The Gradient Boosting algorithm identified the relative importance of each demographic feature:
| Rank | Feature | Importance |
|---|---|---|
| 1 | economically_disadvantaged_pct | 30.3% |
| 2 | white_pct | 13.6% |
| 3 | students_with_disabilities_pct | 11.9% |
| 4 | african_american_pct | 10.4% |
| 5 | limited_english_proficient_pct | 9.1% |
| 6 | hispanic_pct | 7.4% |
| 7 | black_hispanic_native_american_pct | 7.1% |
| asian_pct | 4.0% | |
| 9 | homeless_pct | 3.3% |
| 10 | military_pct | 2.7% |
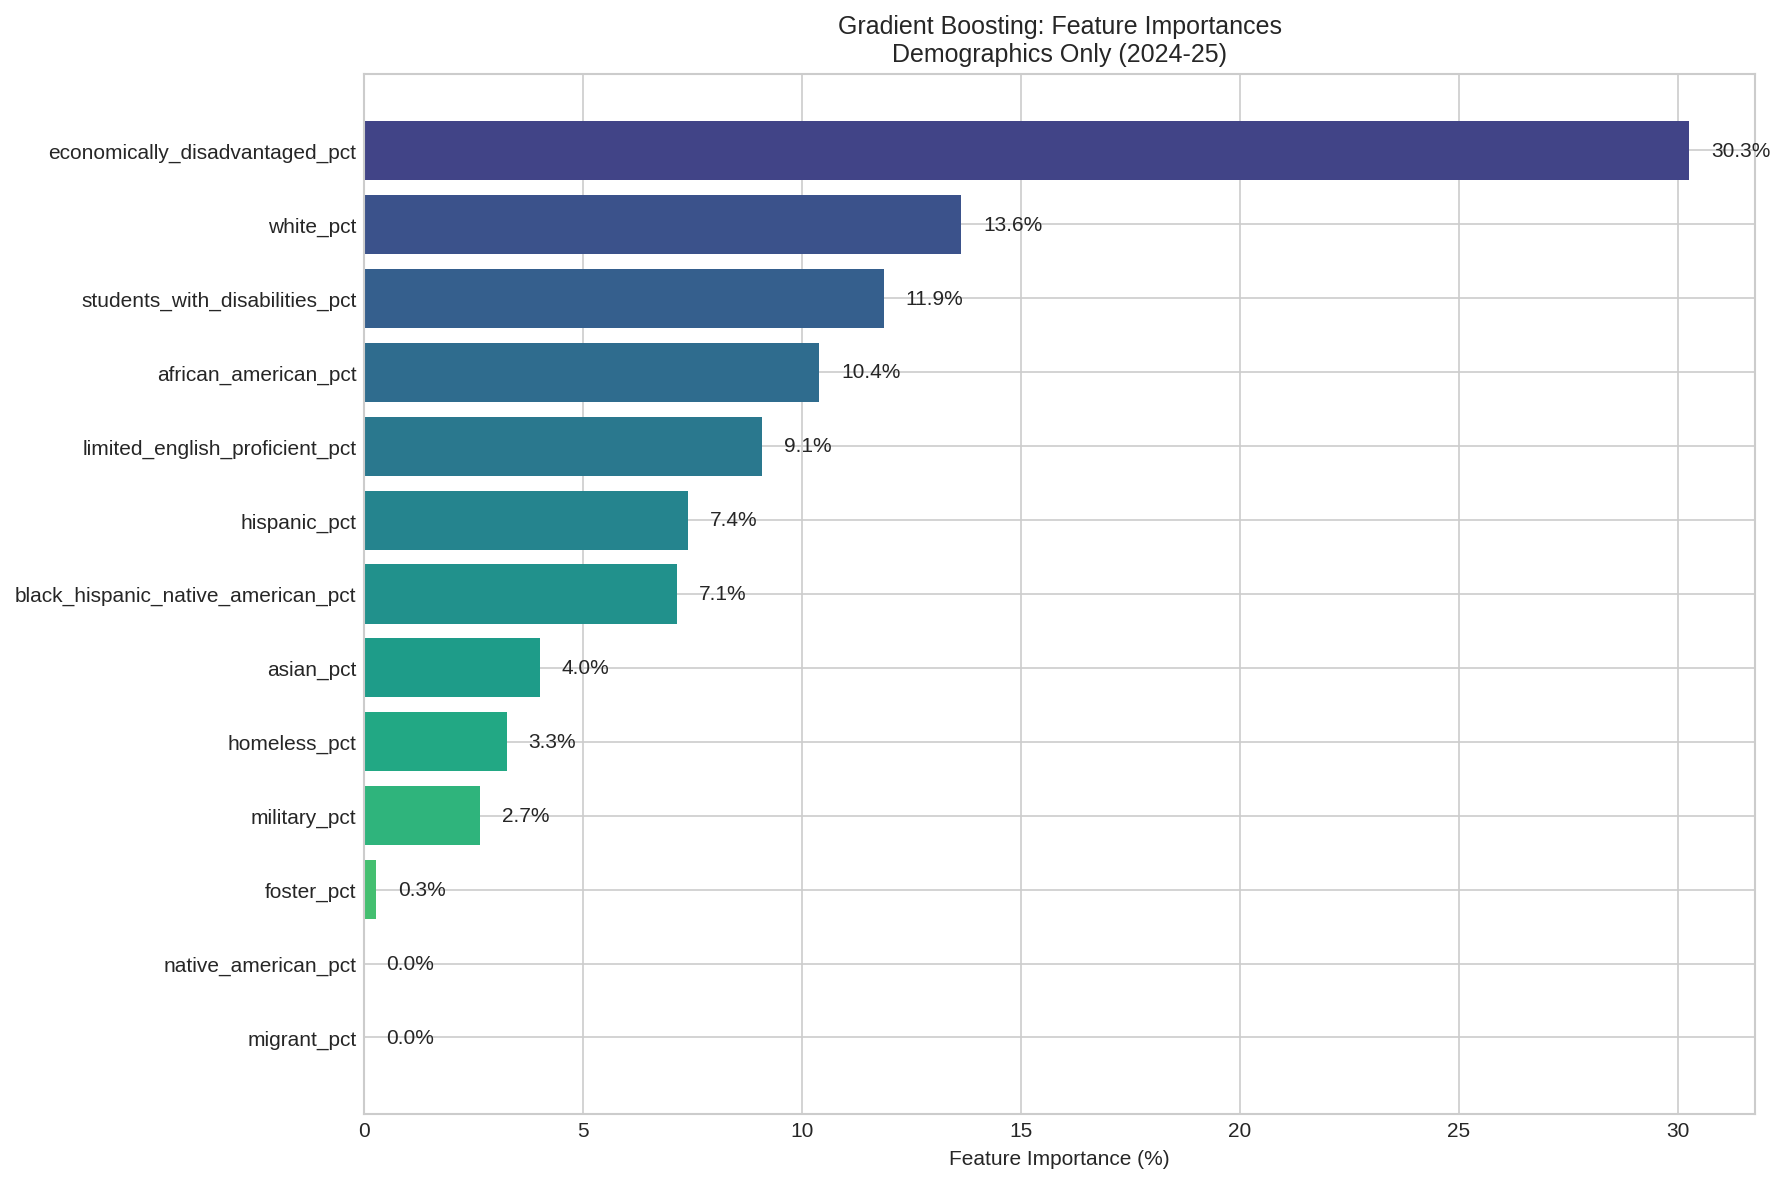
Feature Importance
Economically disadvantaged percentage is by far the most important demographic predictor, accounting for 30% of the model's predictive power.
Confusion Matrix
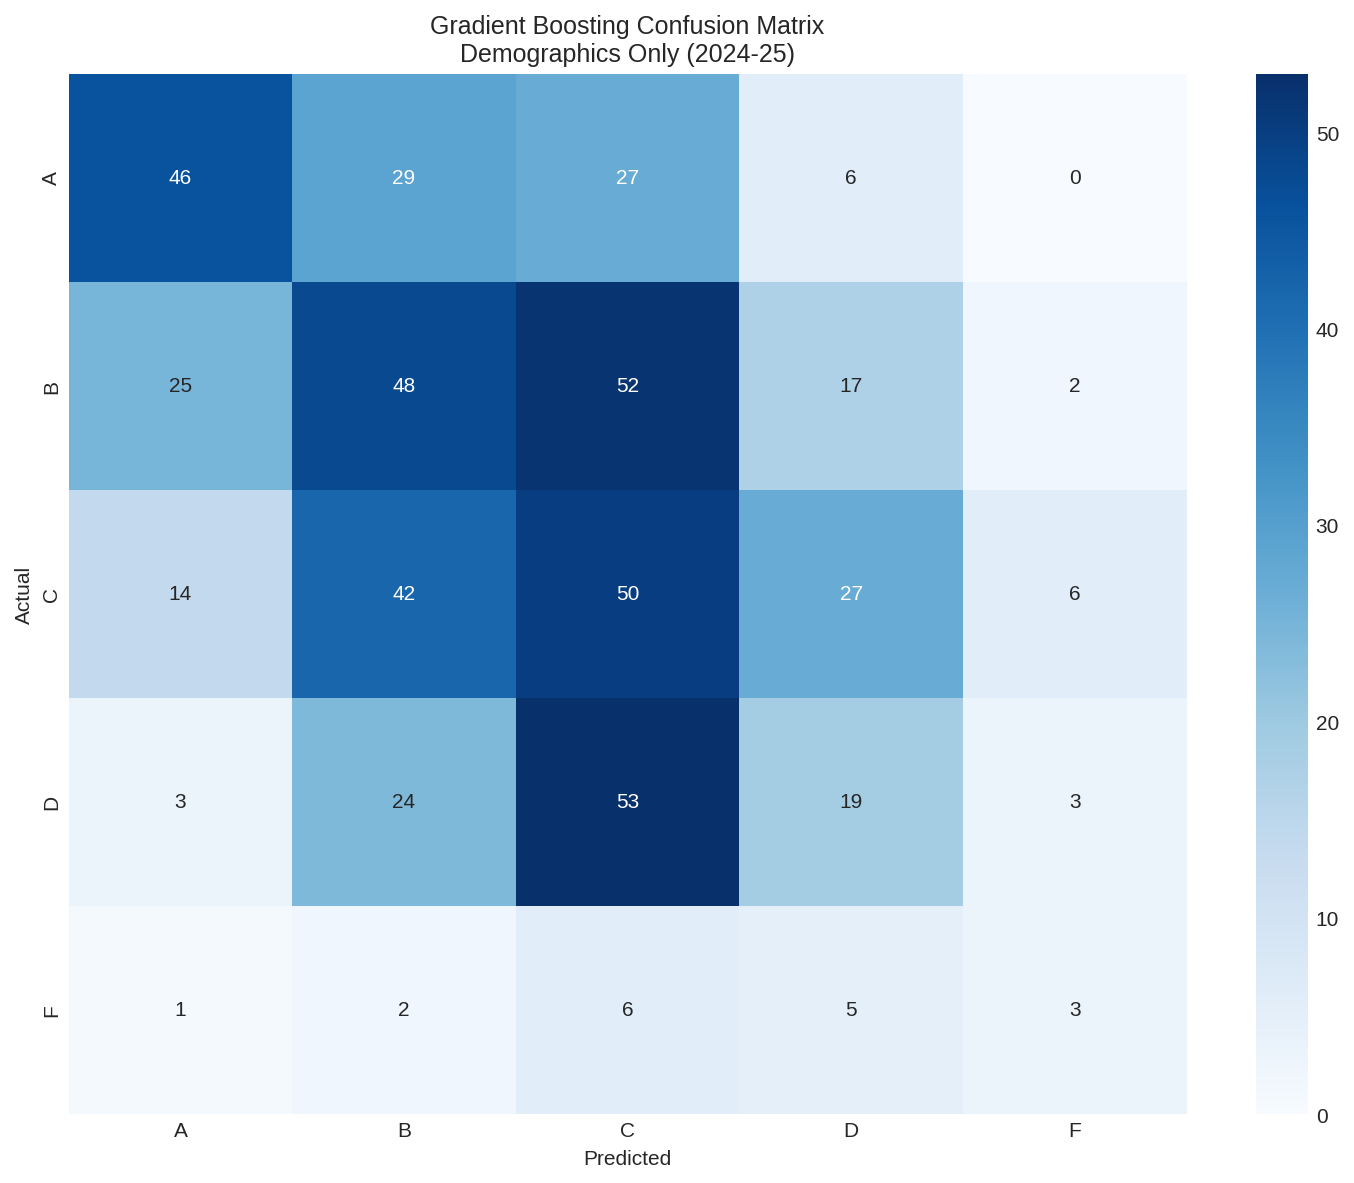
Confusion Matrix
The per-class accuracy shows the model's limitations:
Grade A: 42.6% correct
Grade B: 33.3% correct
Grade C: 36.0% correct
Grade D: 18.6% correct
Grade F: 17.6% correct
The model does best at predicting A grades (schools with favorable demographics that earn A's) but struggles with D's and F's.
Neural Network Regression
I also trained a neural network to predict the continuous letter grade score (1-5) rather than the categorical grade. Using demographics only:
R-squared: 0.23
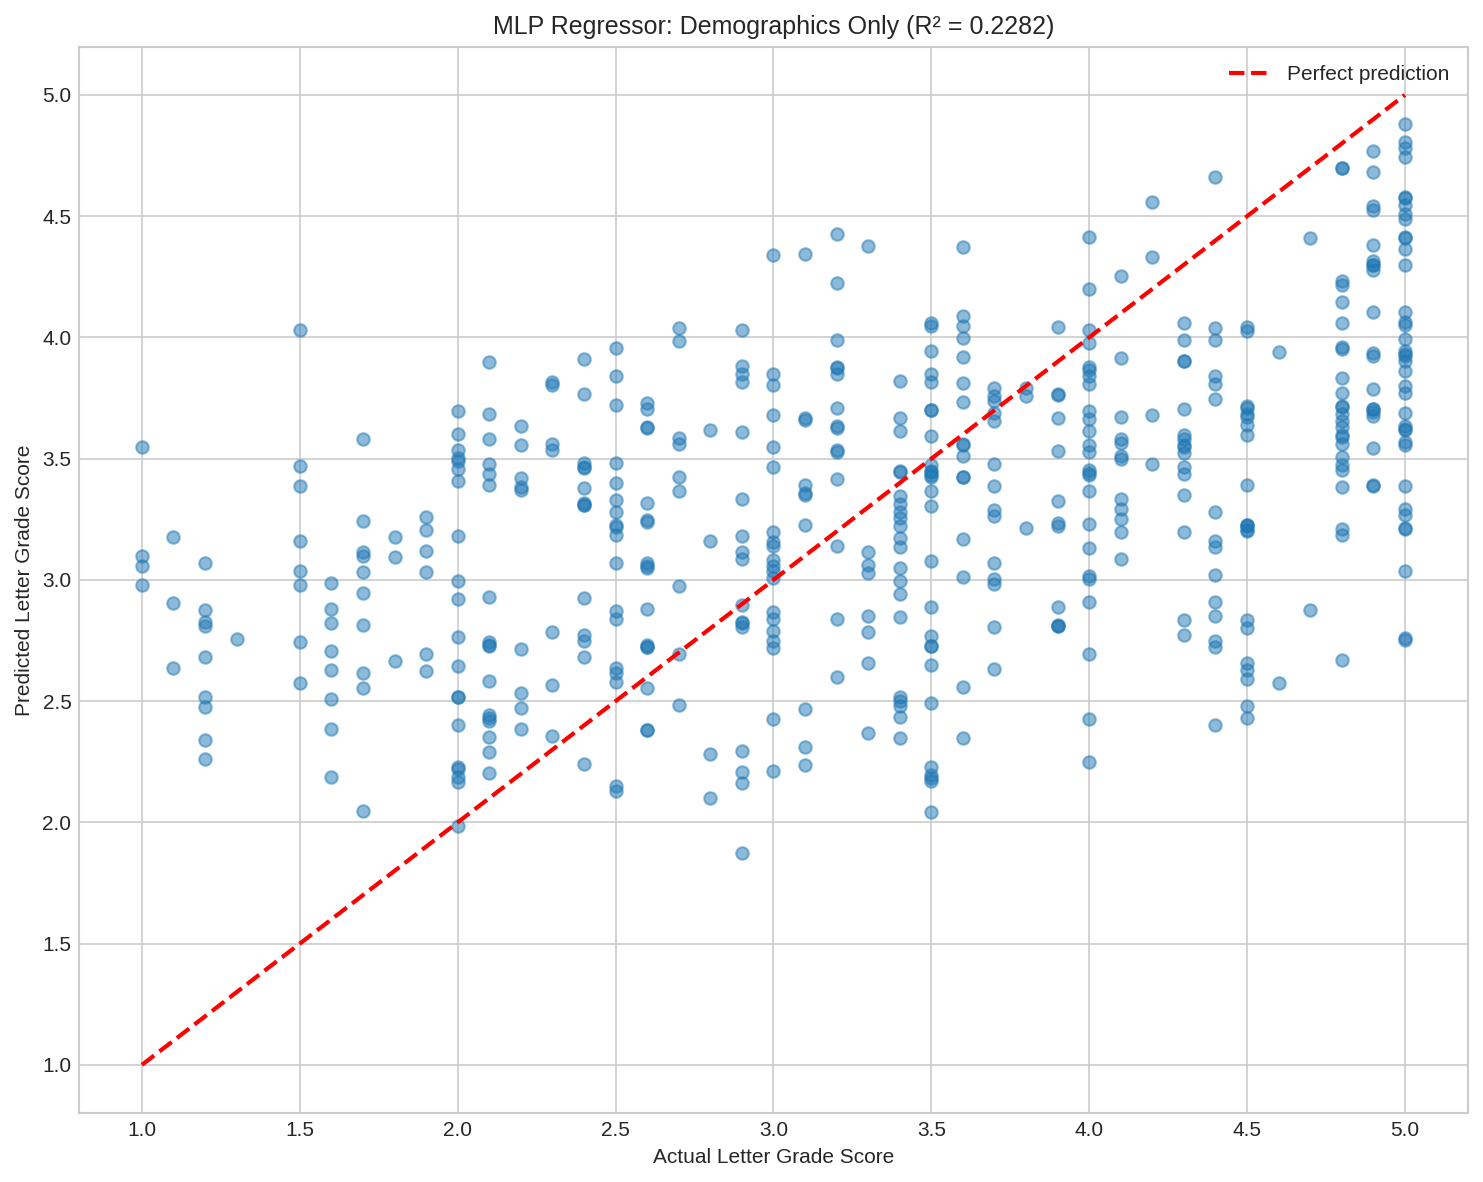
MLP Regressor
Demographics alone explain about 23% of the variance in letter grade scores. This leaves 77% unexplained, meaning the majority of what determines a school's grade is not captured by who attends the school.
What Does This Mean?
The 33% accuracy and 0.23 R-squared are actually encouraging findings. They mean:
Demographics are associated with outcomes but do not determine them. Schools serving similar populations can and do achieve very different results.
The letter grade system is not simply a proxy for poverty or race. While there are correlations, the majority of variance comes from other factors.
Schools serving high-need populations can beat the odds. As shown in the main analysis post, numerous high-poverty and high-diversity schools earn A grades.
That said, the patterns are undeniable. High-poverty clusters have dramatically fewer A's and dramatically more F's than low-poverty clusters. The percentage of economically disadvantaged students is the single strongest demographic predictor of letter grades. Schools serving high-need populations face steeper challenges.
Conclusions
Using only demographic characteristics of the student population, machine learning models can predict letter grades with about 33% accuracy. This is better than random but far from deterministic. Demographics explain roughly 23% of the variance in letter grade scores.
The strongest demographic predictor is the percentage of economically disadvantaged students. Schools with higher poverty rates are more likely to receive lower grades, but the relationship is not destiny. Many schools beat the demographic odds.
This analysis reinforces a key finding from the main letter grade post: while demographics correlate with outcomes, they do not dictate them. The schools that achieve excellence while serving high-need populations deserve recognition and study.
Disclaimer
Keep in mind that these scores are derived from a single test for each subject. This is not the most accurate measure of a student's knowledge, even if it is what gets used for accountability purposes.
Finally, this or any other analysis is not a substitute for doing the right things for students. Building relationships with students, teaching the things that matter in every subject, and helping students develop a love and desire for learning are always going to produce the best results for students no matter what scoring apparatus is used.
This analysis used Python with pandas, scikit-learn, matplotlib, and seaborn for data processing, machine learning, and visualization. I used Claude to do the coding and file management and to proofread my write-up of it.