The model went 33 for 48 through two rounds. Five Round of 32 upsets blew up half the bracket. Here’s what the stacked ensemble says about all eight Sweet 16 games.
Read More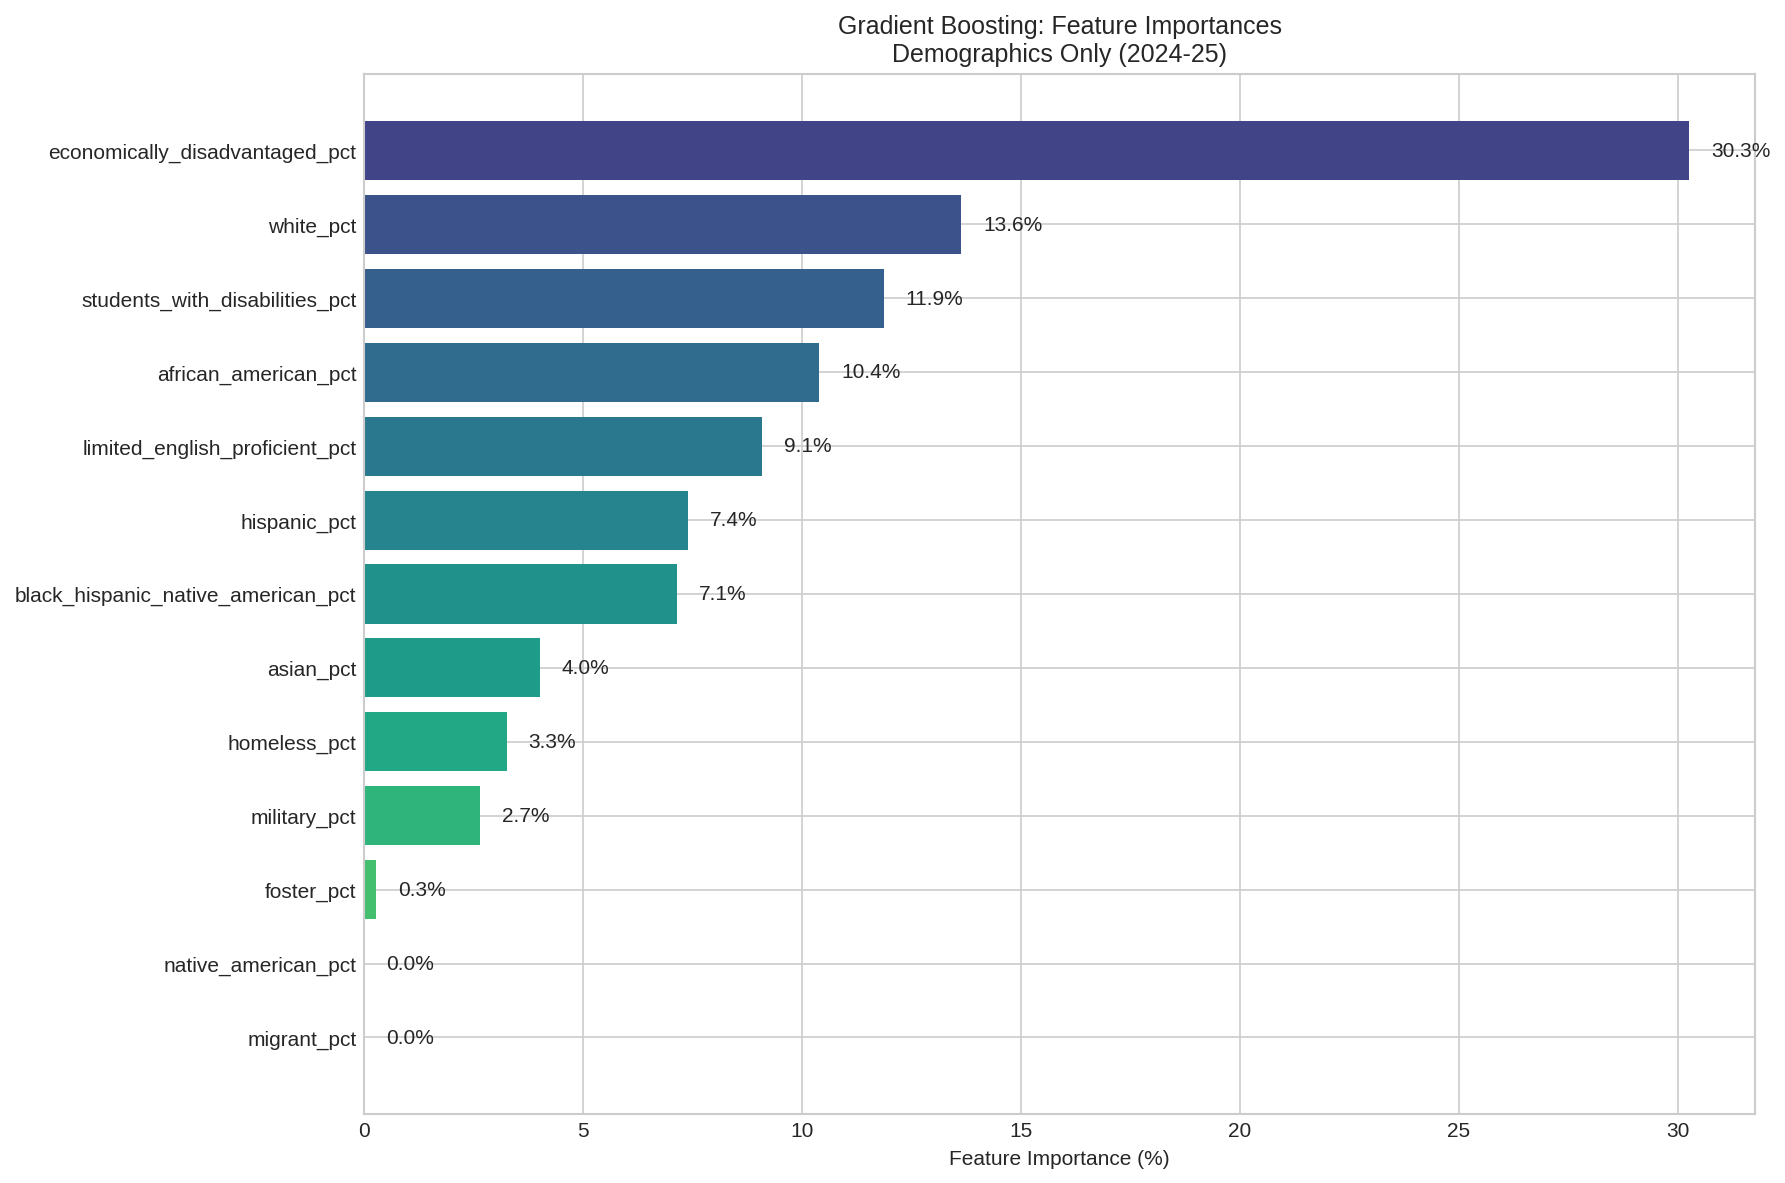

Data & Research
The model went 33 for 48 through two rounds. Five Round of 32 upsets blew up half the bracket. Here’s what the stacked ensemble says about all eight Sweet 16 games.
Read MoreI built a stacked ensemble to fill out my NCAA bracket. It crushed the chalk and missed every upset. Here’s the scorecard.
Read MoreA machine learning analysis of roughly 1,700 Tennessee public schools across two years, comparing what letter grades tell us versus what they hide.
Tennessee gives every public school a letter grade. A through F, just like report cards. The state calculates it from a formula that weighs achievement scores, growth, chronic absenteeism, English learner progress, and for high schools, graduation rates and college/career readiness.
The formula is public. If you know a school's test scores, you can basically calculate the grade yourself. Which raises a question I've been chewing on: what if you strip out all the test-based inputs and just look at the structural stuff, the demographics, staffing, funding, discipline rates, the conditions a school operates under? How much can you predict?
The answer surprised me.
I pulled every publicly available dataset from the Tennessee Department of Education for the 2022-23 and 2023-24 school years: letter grades, school profiles, chronic absenteeism, discipline, educator experience, teacher retention, staffing ratios, per-pupil expenditures, funding sources, graduation rates, and dropout rates. Merged them all at the school level. About 1,690 eligible schools per year, observed across both years for 3,381 school-year observations.
Then I deliberately removed every variable that directly feeds Tennessee's letter grade formula. No achievement scores, no growth scores, no success rates, no CCR rates. What remained were 33 contextual features: things like percent economically disadvantaged, chronic absenteeism, teacher retention, per-pupil spending, and demographic composition.
I ran the analysis two ways. First, I tried to classify the letter grade itself (A through F). Then I switched the target to overall success rate, the continuous achievement percentage that drives the letter grade. Same features, different targets. The comparison is telling.
Five models. Random Forest, XGBoost, Gradient Boosting, Logistic Regression, and an Ordinal Logistic model that respects the A > B > C > D > F ordering. Best accuracy across the board: about 40%.
| Model | Accuracy | CV Accuracy | Mean Absolute Error |
|---|---|---|---|
| Logistic Regression | 41.8% | 39.9% | 0.73 grades |
| Ordinal Logistic | 41.4% | 40.1% | 0.74 grades |
| Random Forest | 40.2% | 40.3% | 0.75 grades |
| XGBoost | 34.4% | 40.6% | 0.83 grades |
| Gradient Boosting | 37.1% | 39.6% | 0.79 grades |
40% accuracy across five categories is better than random (20%), but not great. The models were off by about 0.75 letter grades on average. If a school is a C, the model might guess B or D. Close, but noisy.
The letter grade bins are doing real damage here. A school with a 49% success rate and a school with a 51% success rate might land in different grade buckets, but structurally they're nearly identical. The model sees the same features and reasonably groups them together, but the grading system draws an arbitrary line between them.
Same 33 contextual features. Same schools. But instead of predicting A/B/C/D/F, I targeted the overall success rate, a continuous percentage from 5% to 95%.
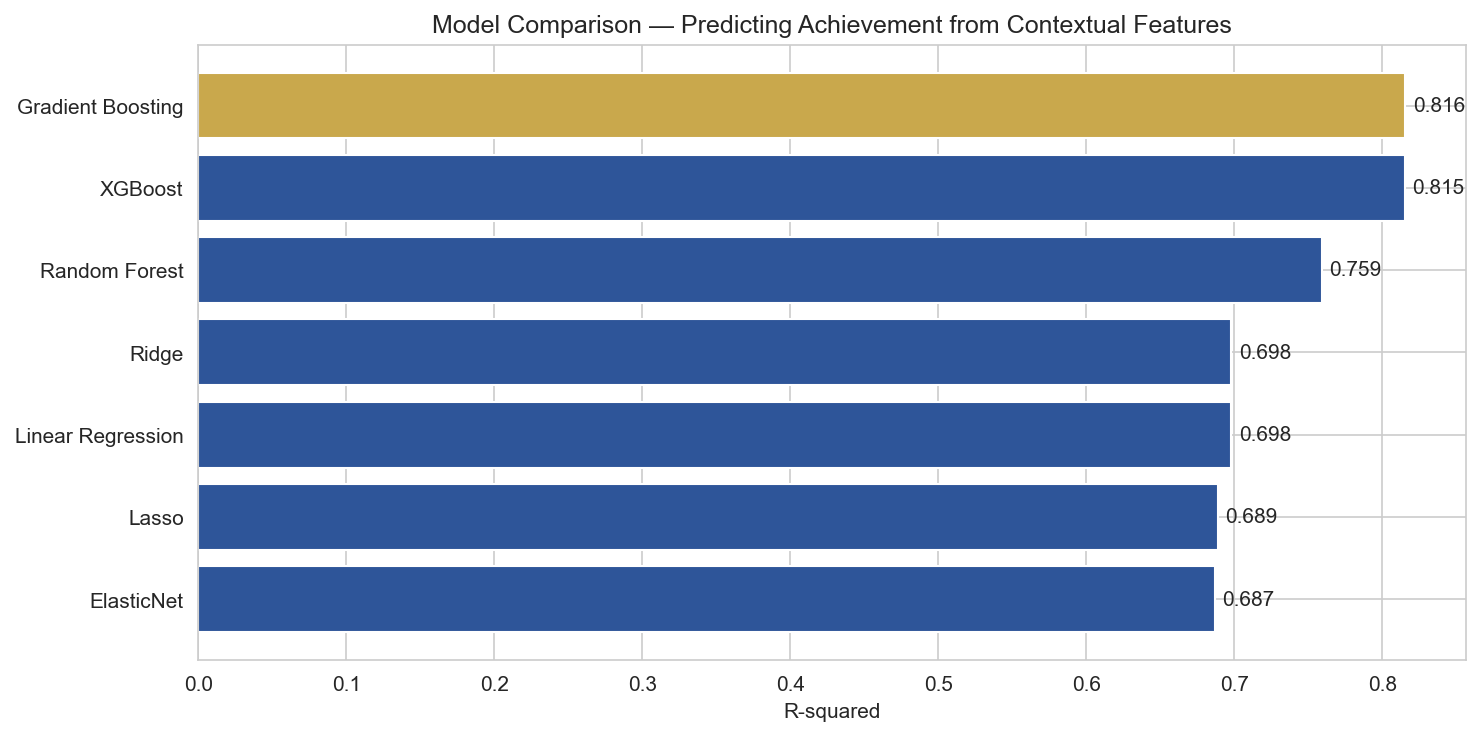
R-squared comparison across models. Gradient Boosting and XGBoost both explain over 81% of variance in achievement.
| Model | R-squared | Mean Absolute Error | CV R-squared |
|---|---|---|---|
| XGBoost (Tuned) | 0.823 | 5.5 pct pts | — |
| Gradient Boosting | 0.816 | 5.6 pct pts | 0.819 |
| XGBoost | 0.815 | 5.7 pct pts | 0.822 |
| Random Forest | 0.759 | 6.4 pct pts | 0.783 |
| Ridge Regression | 0.698 | 7.2 pct pts | 0.663 |
| Linear Regression | 0.698 | 7.2 pct pts | 0.615 |
| Lasso | 0.689 | 7.3 pct pts | 0.661 |
That is a massive jump. The same features that could only guess a letter grade 40% of the time can explain 82% of the variance in achievement when you let the model see the actual number instead of a bucketed label.
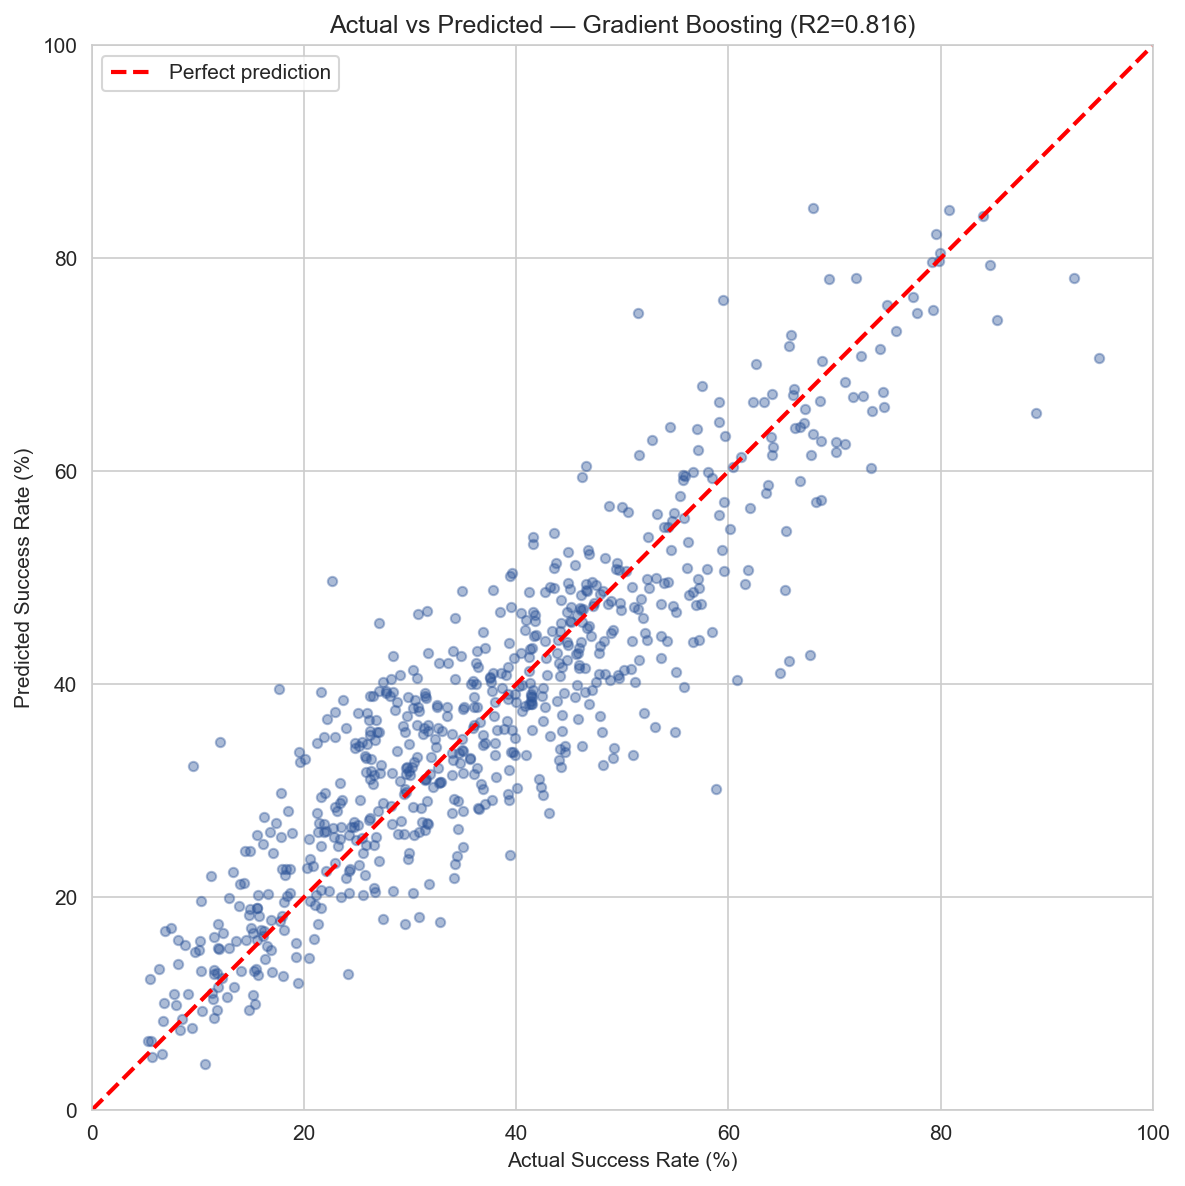
Actual vs. predicted achievement. Points cluster around the diagonal, with an MAE of about 5.5 percentage points.
SHAP (SHapley Additive exPlanations) tells us not just which features matter, but how much they move the needle and in which direction. The units here are percentage points of achievement.

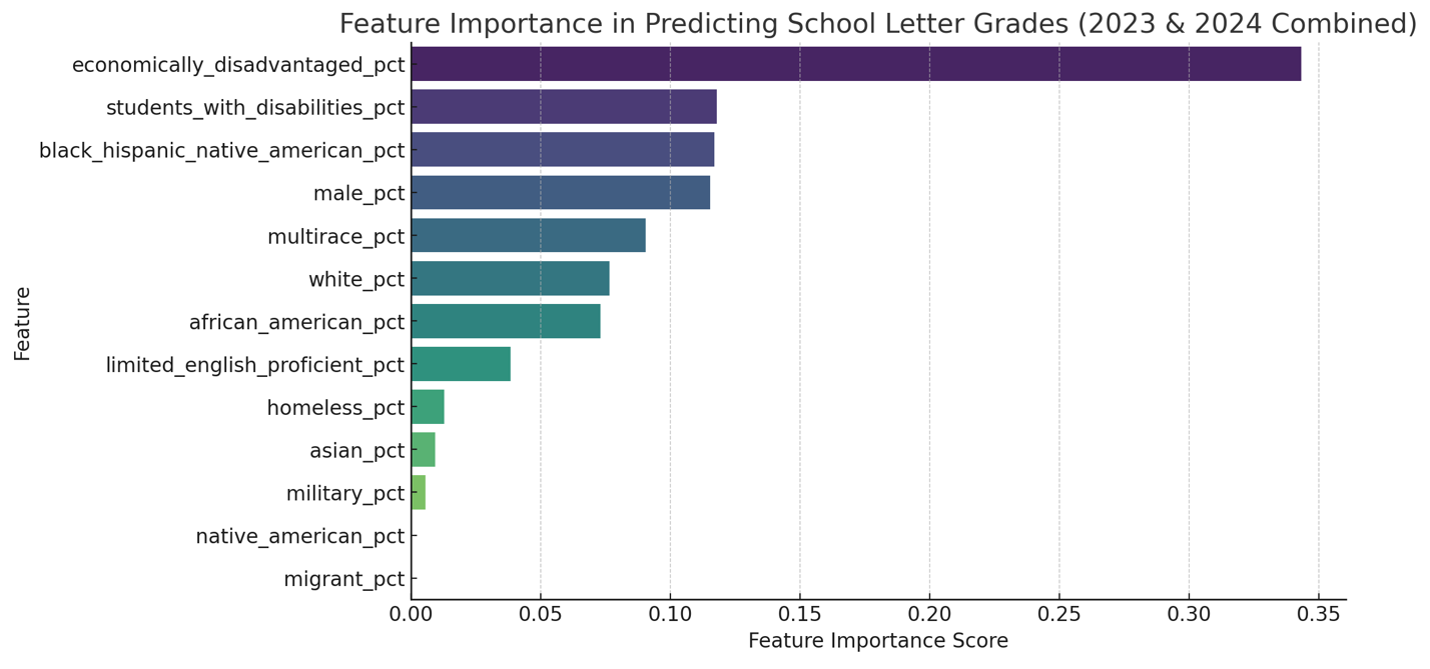
Feature importance measured by mean absolute SHAP value. Two features dominate everything else.
Two features tower over the rest:
After those two, a cluster of second-tier features emerges: local funding percentage (positive), demographic composition, experienced teachers (positive), teacher retention (positive), and discipline rates (negative). Each of these contributes roughly 0.6 to 1.3 percentage points.
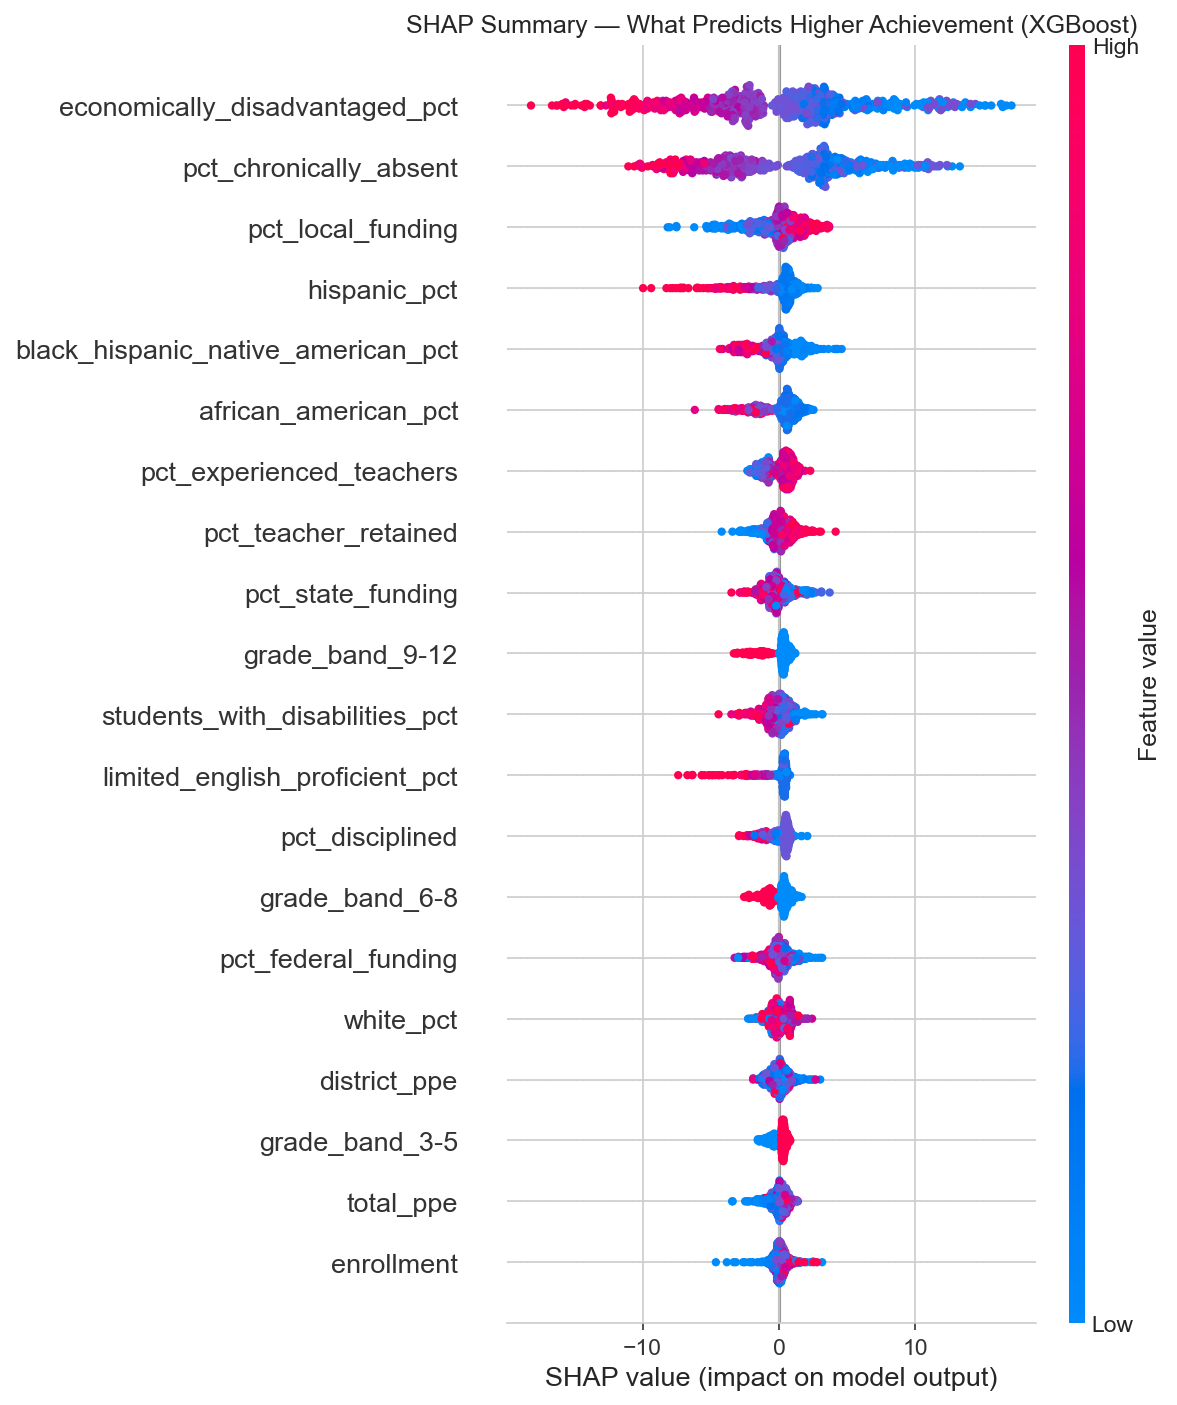
SHAP beeswarm plot. Each dot is one school. Red means high feature value, blue means low. Dots pushed right increase the predicted success rate, dots pushed left decrease it.
Look at that SHAP summary. High economically disadvantaged percentage (red dots) consistently pushes predictions left (lower achievement). High chronic absenteeism does the same. High local funding and experienced teacher percentages push right (higher achievement). The patterns are clear and consistent.
The letter grade classification flopped not because the features lack signal, but because the grading system collapses a continuous reality into five bins. A school at the 49th percentile and a school at the 51st percentile might be structurally identical, but one gets a C and the other a B. The model can't distinguish them because there's nothing structurally distinguishing to find.
When you let the model predict the actual achievement percentage, it stops fighting artificial boundaries and starts learning the real relationship between conditions and outcomes. The same data that produced a mediocre 40% classifier produces an R-squared of 0.82 when you ask the right question.
This is a data science lesson wrapped in education policy. If your outcome variable is discretized from something continuous, you're throwing away information. The letter grade system takes a rich, nuanced distribution of achievement and flattens it into a handful of buckets.
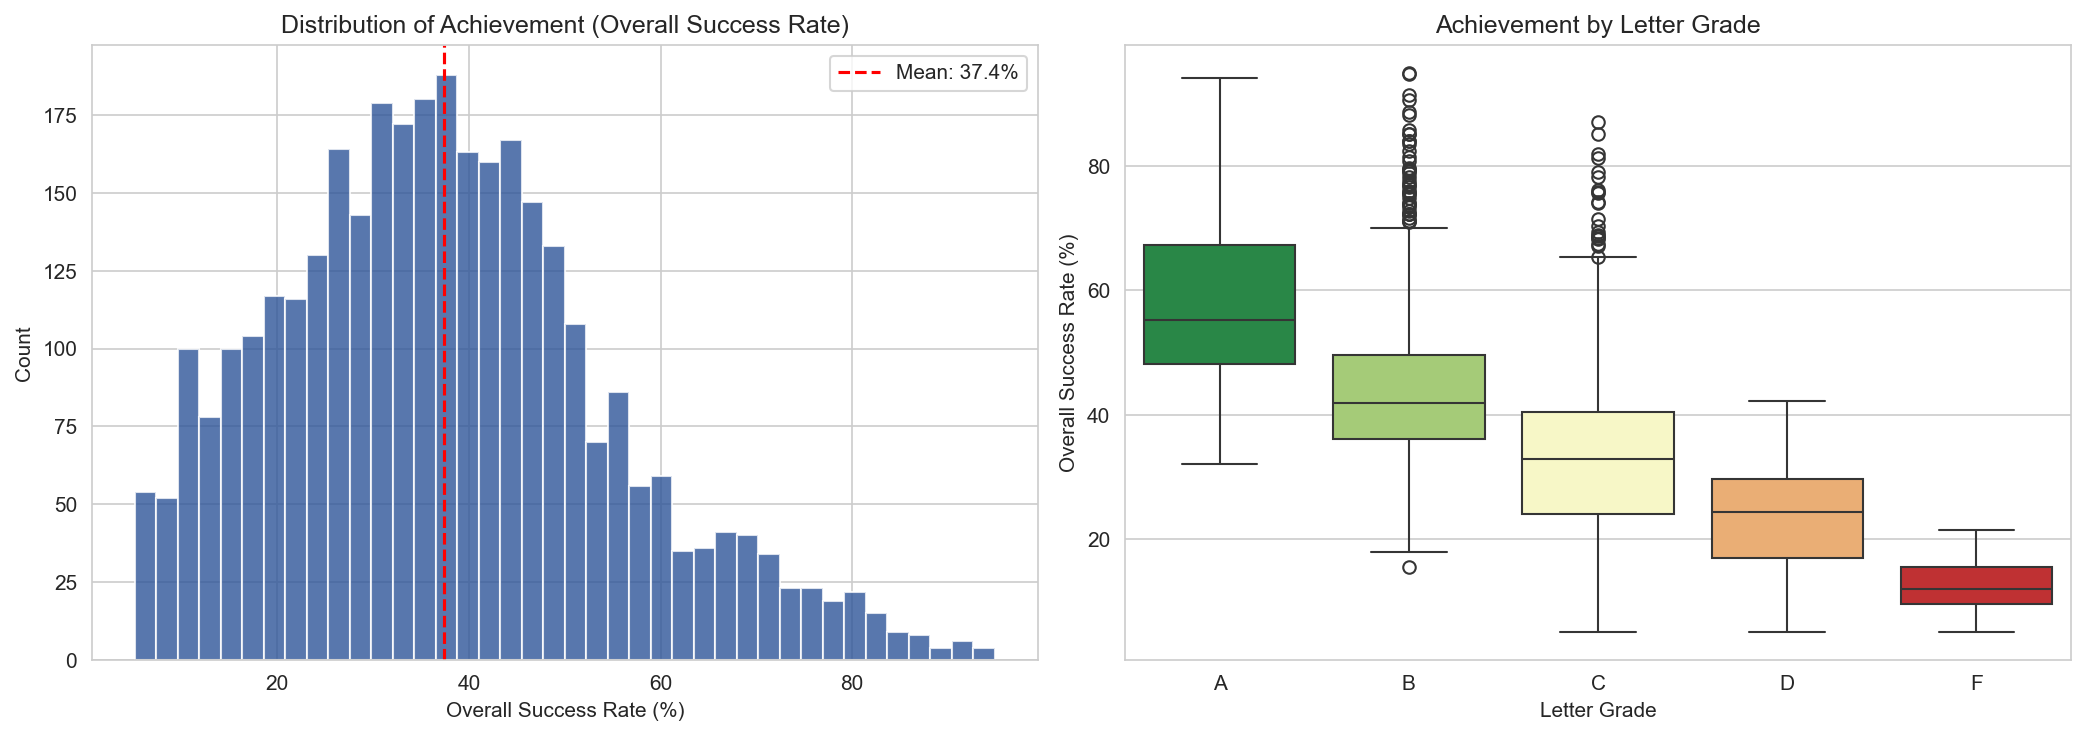
Left: the actual distribution of achievement across Tennessee schools. Right: the same data, grouped by letter grade. Notice the overlap, especially between B, C, and D schools.
I work for Greeneville City Schools, so I ran our numbers through the same lens. The model says poverty and absenteeism explain 82% of achievement. GCS has a district-wide economically disadvantaged rate around 29%, which puts us in the middle of the pack. Based on structural factors alone, the model would predict us to land somewhere around the state average.
We don't.
In 2023-24, four of our seven schools earned A grades. Here's every GCS school, year over year:
| School | ED % | 2022-23 | 2023-24 | Change |
|---|---|---|---|---|
| Eastview Elementary | 18% | 56.9% (A) | 61.2% (A) | +4.3 pts |
| Tusculum View Elementary | 27% | 41.8% (B) | 50.0% (A) | +8.2 pts |
| Greeneville High School | 24% | 50.0% (A) | 48.4% (A) | -1.6 pts |
| Greeneville Middle School | 24% | 44.9% (B) | 47.8% (A) | +2.9 pts |
| Hal Henard Elementary | 36% | 49.7% (B) | 48.3% (C) | -1.4 pts |
| Highland Elementary | 54% | 32.6% (C) | 36.5% (C) | +3.9 pts |
| TOPS Greeneville | 17% | 29.1% (D) | 37.5% (C) | +8.4 pts |
Five of seven schools improved, several significantly. Tusculum View jumped from a B to an A with an 8.2-point gain. TOPS Greeneville climbed 8.4 points and moved from a D to a C. Even Highland Elementary, our highest-poverty school at 54% ED, scored 36.5%, well above the 24% state average for schools in that ED range. Highland ranks 13th out of 131 schools with similar poverty levels statewide.
The model says schools like ours should perform at a certain level given our demographics. We keep outperforming that prediction, and the gap is widening. That's not an accident. That's what happens when experienced teachers stay (we have strong retention), absenteeism is managed, and the district invests in the things that actually move the needle.
If you run a school district in Tennessee, here is what 1,700 schools, two years of data, and seven models are telling you:
None of this is new to anyone who runs schools. We all know poverty predicts outcomes. But there's a difference between knowing it and seeing a machine learning model explain 82% of the variance with nothing but contextual features. It puts a precise number on something we've felt in our bones for years.
The uncomfortable implication: Tennessee's letter grade system is, to a large degree, grading the ZIP code. A school's structural context is doing most of the talking, and the letter grade is mostly just a noisy echo of it. But districts like Greeneville show it doesn't have to be destiny. The 18% of variance the model can't explain? That's where the work happens.
Data: Tennessee Department of Education public data downloads for 2022-23 and 2023-24. All school-level. Schools flagged as ineligible for letter grades were excluded. Approximately 1,690 unique schools observed across both years, yielding 3,381 school-year observations (3,345 with valid achievement data).
Features: 33 contextual variables across demographics, teacher quality, discipline, absenteeism, finance, staffing, graduation, and dropout. All formula-input features (achievement scores, growth scores, success rates, CCR rates) were deliberately excluded.
Models: Seven regression models (Linear, Ridge, Lasso, ElasticNet, Random Forest, Gradient Boosting, XGBoost) plus hyperparameter tuning via RandomizedSearchCV. Five classification models for the letter grade comparison. 80/20 train/test split, stratified. 5-fold cross-validation on training sets.
SHAP values computed via TreeExplainer on the XGBoost regression model. All code available on request.
Can student demographics alone predict a school's letter grade? Using machine learning algorithms like Gradient Boosting and K-means clustering, this analysis explores the deep (but not deterministic) link between poverty, diversity, and Tennessee's latest accountability scores.
Read MoreThe Tennessee Department of Education released the 2024-25 school letter grades on December 18, 2024. This is the third year of letter grades under the revamped formula that emphasizes academic achievement over growth. In this post, I continue my analysis of these letter grades, examining distribution trends, demographic correlations, and standout schools.
The data files used for this analysis are available from the Tennessee Department of Education's data downloads page. I merged the 2024-25 Letter Grade File with the 2024-25 School Profile data to examine demographic patterns.
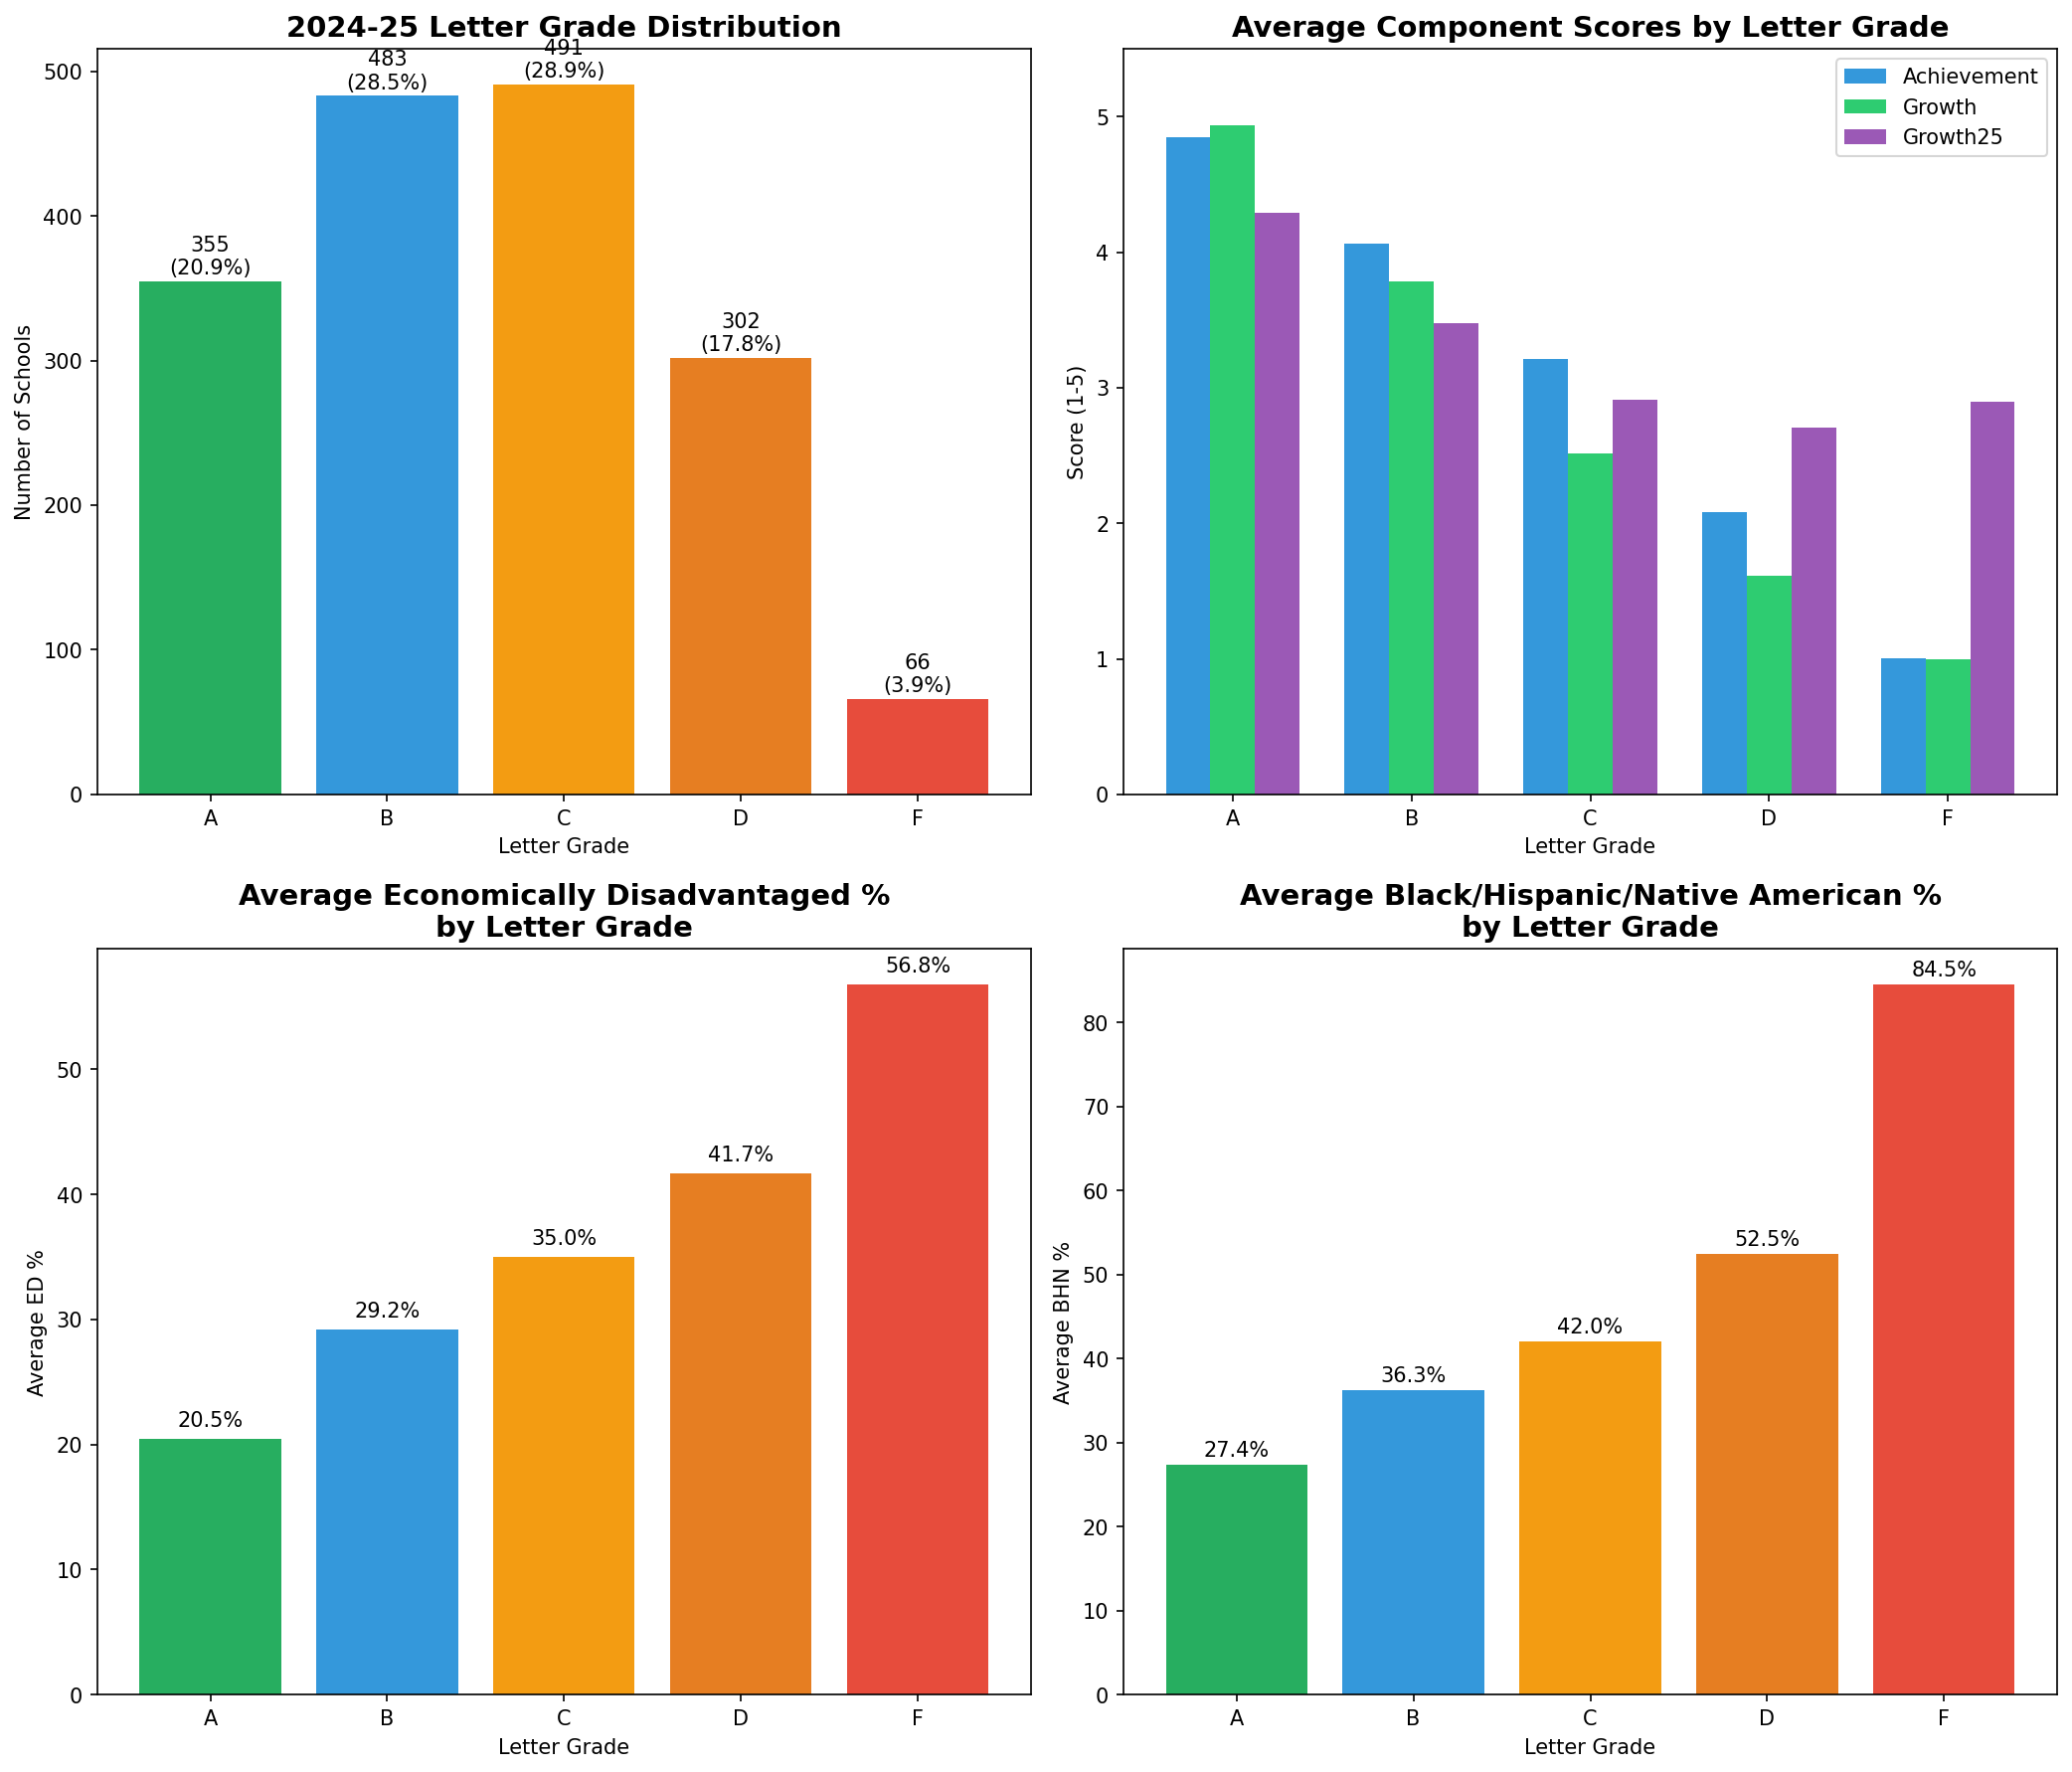
Out of 1,905 schools listed for letter grades, 208 (10.9%) were ineligible to receive a grade. These schools were excluded from this analysis, leaving 1,697 eligible schools.
The 2024-25 letter grades were distributed as follows:
A: 355 (20.9%)
B: 483 (28.5%)
C: 491 (28.9%)
D: 302 (17.8%)
F: 66 (3.9%)
This continues the positive trend we've seen over the past three years. The percentage of A schools has increased from 17.4% in 2022-23 to 20.9% in 2024-25, while F schools have decreased from 5.4% to 3.9%.
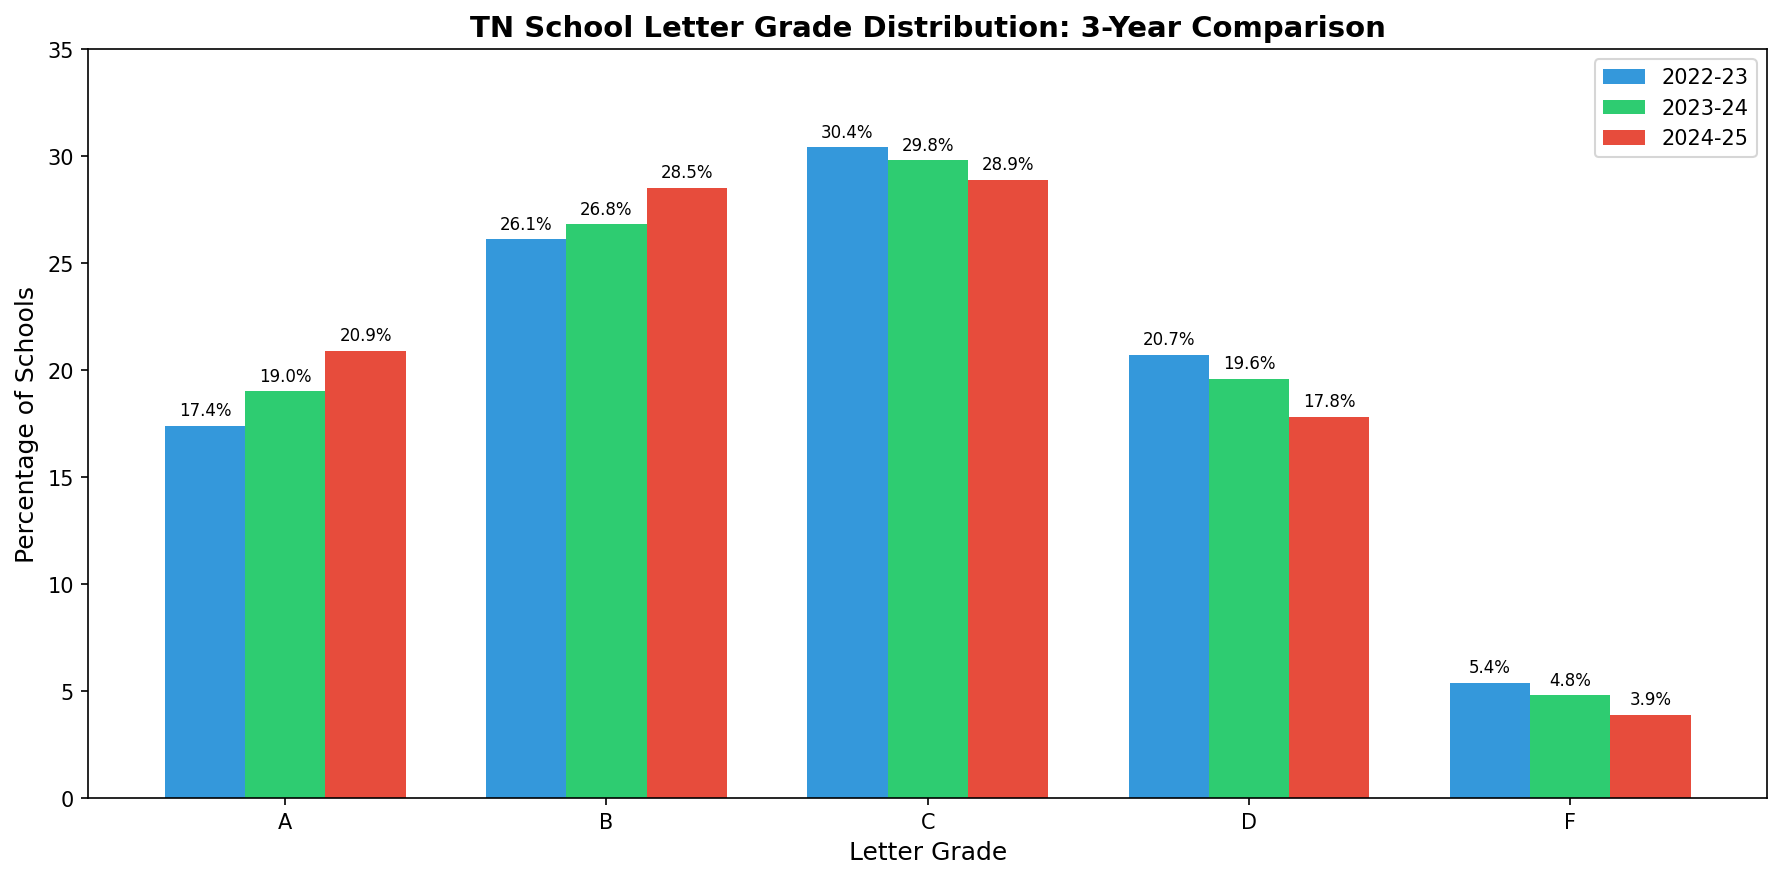
Distribution Comparison
| Grade | 2022-23 | 2023-24 | 2024-25 | 3-Year Change |
|---|---|---|---|---|
| A | 17.4% | 19.0% | 20.9% | +3.5% |
| B | 26.1% | 26.8% | 28.5% | +2.4% |
| C | 30.4% | 29.8% | 28.9% | -1.5% |
| D | 20.7% | 19.6% | 17.8% | -2.9% |
| F | 5.4% | 4.8% | 3.9% | -1.5% |
The data shows steady improvement: more schools are earning A's and B's while fewer are receiving D's and F's.
| Grade | Achievement | Growth | Growth25 | Success Rate | LG Score |
|---|---|---|---|---|---|
| A | 4.85 | 4.94 | 4.29 | 58.2% | 4.83 |
| B | 4.06 | 3.78 | 3.47 | 44.5% | 3.91 |
| C | 3.21 | 2.52 | 2.91 | 35.4% | 2.94 |
| D | 2.08 | 1.61 | 2.71 | 23.7% | 2.01 |
| F | 1.00 | 1.00 | 2.90 | 12.5% | 1.18 |
A notable pattern persists from previous years: schools with an F grade actually show higher Growth25 scores (2.90) than D schools (2.71). This metric measures the progress of the lowest-performing 25% of students. While F schools are making gains with their struggling students, this improvement is not sufficiently weighted to improve their overall letter grade.
Summary Dashboard
The relationship between demographic factors and letter grades remains significant.
| Grade | 2022-23 | 2023-24 | 2024-25 |
|---|---|---|---|
| A | 18.3% | 22.3% | 20.5% |
| B | 28.9% | 31.1% | 29.2% |
| C | 36.5% | 38.9% | 35.0% |
| D | 42.0% | 45.9% | 41.7% |
| F | 54.5% | 49.6% | 56.8% |
| Grade | 2022-23 | 2023-24 | 2024-25 |
|---|---|---|---|
| A | 21.8% | 35.8% | 27.4% |
| B | 27.7% | 48.7% | 36.3% |
| C | 39.5% | 56.0% | 42.0% |
| D | 55.0% | 65.8% | 52.5% |
| F | 80.1% | 82.2% | 84.5% |
The gap between A schools and F schools remains substantial. A schools average 20.5% economically disadvantaged students compared to 56.8% in F schools. For BHN students, the gap is even more pronounced: 27.4% in A schools versus 84.5% in F schools.
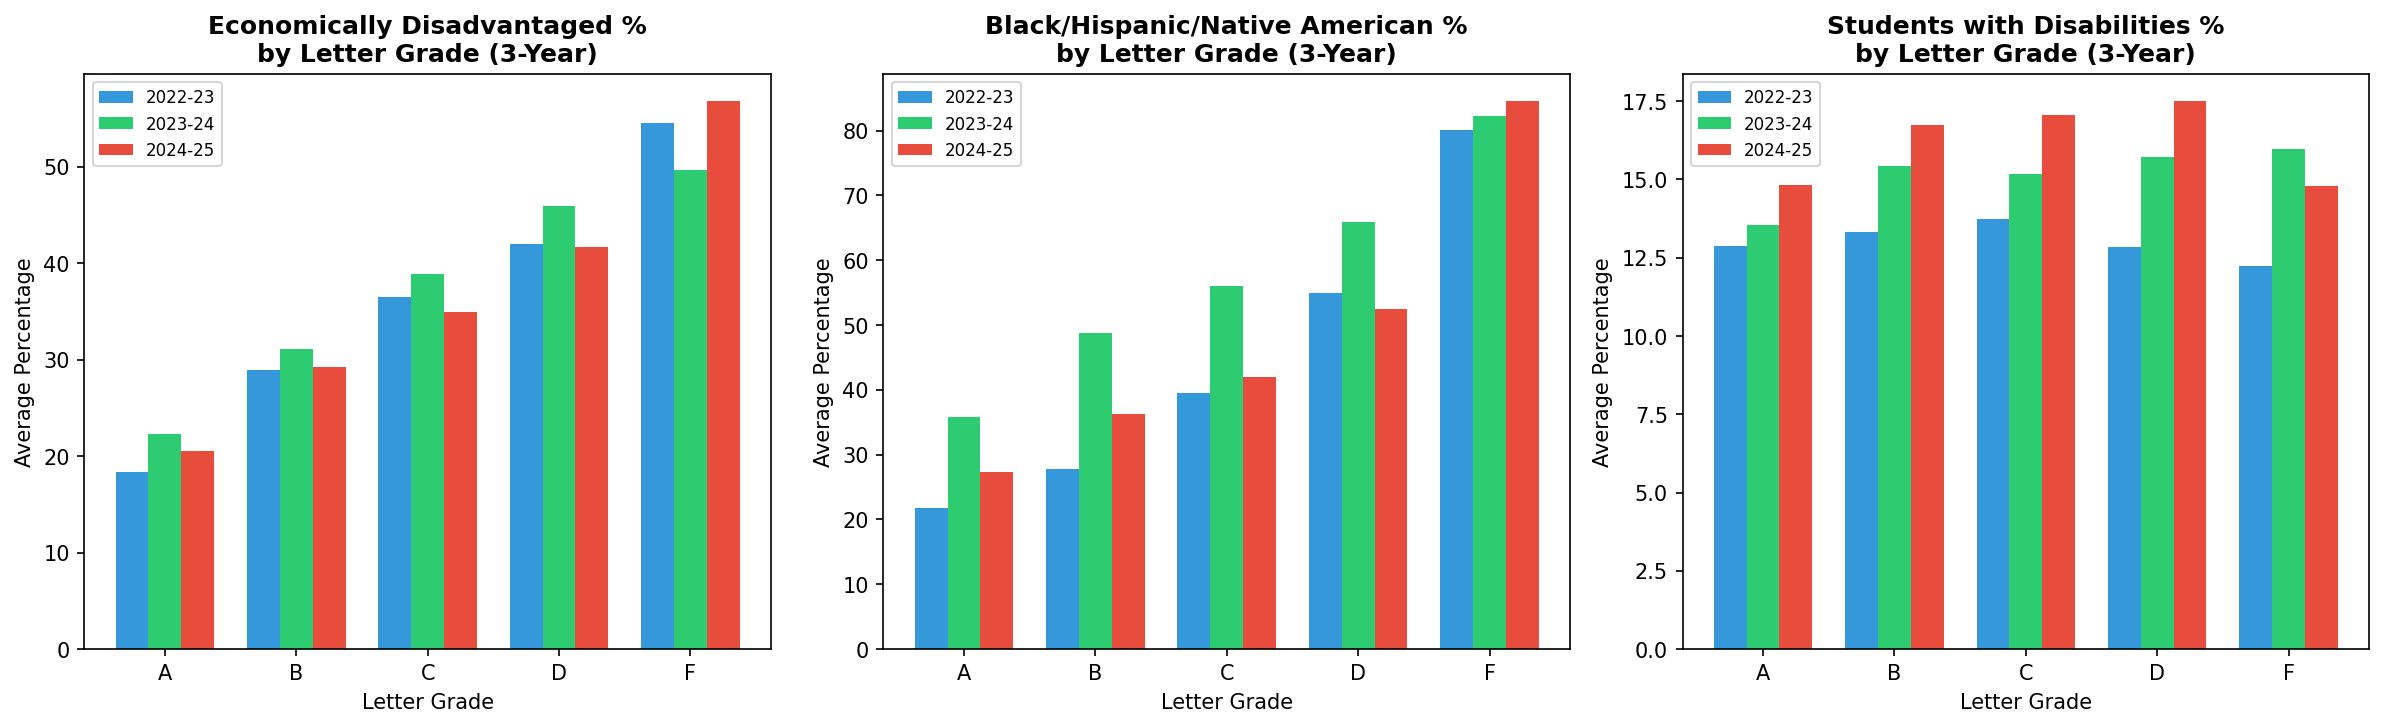
Subgroup Three-Year Comparison
The correlations between demographic factors and letter grade scores show a consistent pattern across all three years:
| Subgroup | 2022-23 | 2023-24 | 2024-25 |
|---|---|---|---|
| Economically Disadvantaged | -0.50 | -0.44 | -0.47 |
| Black/Hispanic/Native American | -0.37 | -0.39 | -0.34 |
| Students with Disabilities | -0.09 | -0.13 | -0.12 |
The correlation between economically disadvantaged percentage and letter grade score (r = -0.47) indicates a moderate negative relationship. Schools with higher percentages of economically disadvantaged students tend to receive lower letter grades.
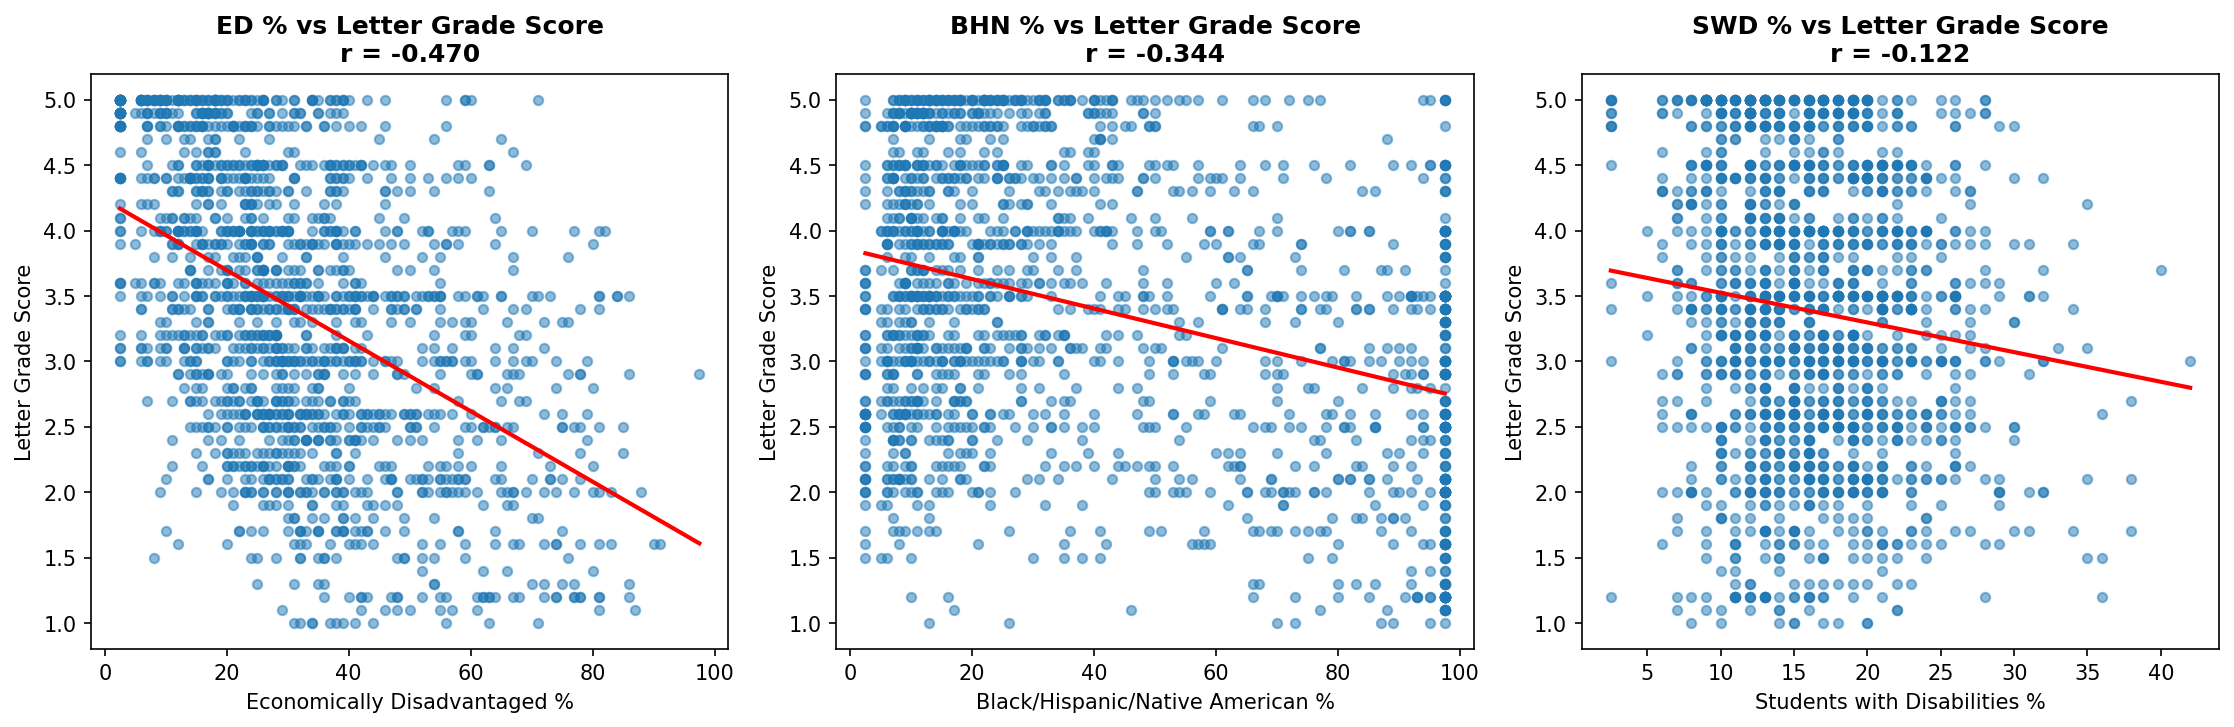
Correlation Scatterplots
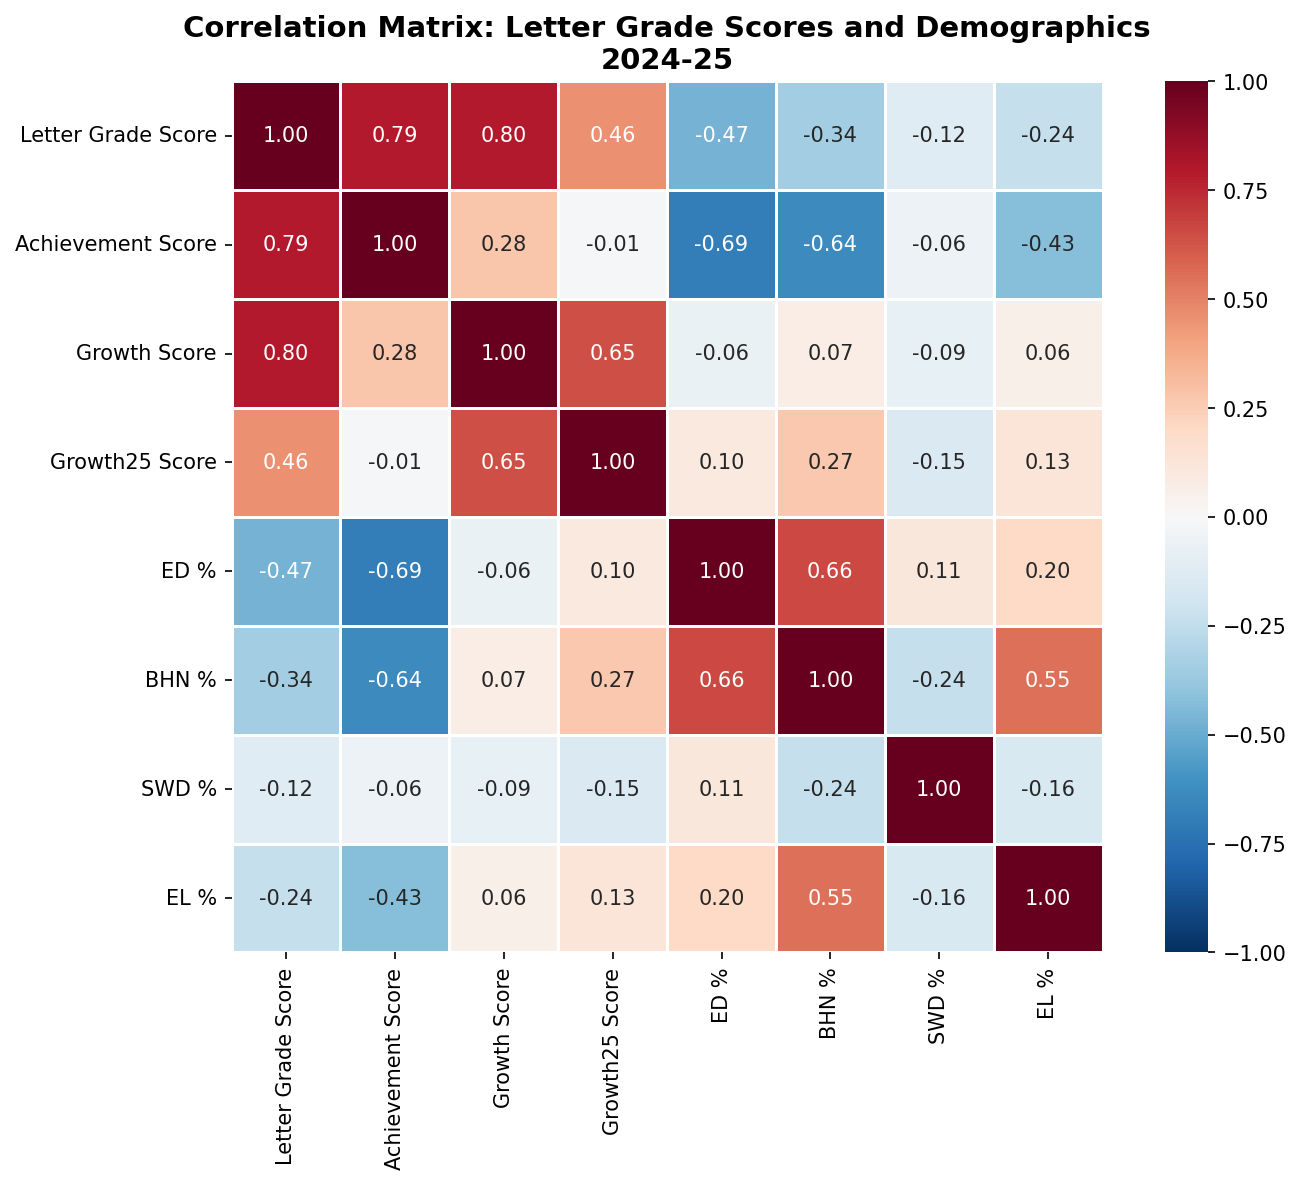
Correlation Heatmap
The 2024-25 letter grades show continued improvement across Tennessee schools. Key findings include:
1. More schools are earning A's (20.9%, up from 17.4% three years ago) and fewer are receiving F's (3.9%, down from 5.4%).
2. The correlation between poverty and letter grades remains strong (r = -0.47), but some high-poverty schools continue to beat the odds.
3. F schools continue to show strong Growth25 scores, meaning they are making progress with their lowest-performing students, but this is not reflected in their overall grades.
The letter grade system continues to simplify complex accountability measures into easily digestible grades. While this provides transparency for families and communities, it's important to remember that these grades are heavily influenced by factors outside of schools' direct control, including poverty and segregation. Schools serving high-need populations face steeper challenges in achieving high letter grades, making the success of many schools all the more remarkable.
Also, it is important to note that many schools in Northeast TN (Johnson, Carter, Unicoi, Greene, and Washington Counties) went through major flooding in the fall, and they worked very hard to just have school, much less show improvement in accountability data.
This analysis used Python with pandas, matplotlib, seaborn, and scipy for data processing and visualization. I used Claude to do the coding and proof my writing.
In early 2024, I published a blog post exploring how machine learning could predict Tennessee school letter grades based on demographic data. That analysis provided insight into the structural factors influencing school performance metrics, particularly the significant role of economic disadvantage. Since then, I’ve expanded the dataset to include both the 2023 and 2024 school letter grades, refining the model to capture trends over time and further assess the predictive power of demographic variables. This post serves as an update on that work and a precursor to a more detailed research paper.
Tennessee assigns letter grades (A–F) to schools based on multiple criteria, including student achievement, academic growth, and college/career readiness. While these grades are intended to reflect school quality, they often correlate strongly with socioeconomic and demographic factors.
For this updated analysis, I merged data from both years to improve model robustness. The methodology remained consistent:
Data Collection: Letter grades and demographic data were sourced from the Tennessee Department of Education.
Data Processing: Letter grades were converted to a numeric scale, and missing values were cleaned.
Machine Learning Models:
Random Forest Regression for feature importance analysis
Linear Regression to estimate the impact of individual factors
Correlation Analysis to identify relationships between variables
Letter Grade Scale
A 4.5-5.0
B 3.5-4.4
C 2.5-3.4
D 1.5-2.4
F 1.0-1.4
Economic Disadvantage Remains the Strongest Predictor
Schools with higher percentages of economically disadvantaged students continue to receive lower letter grades. The model estimates that for every 10% increase in economically disadvantaged students, the expected letter grade drops by 0.35 on a 1.0–5.0 scale.
Special Education Enrollment Also Impacts Letter Grades
The presence of students with disabilities (SWDs) is another contributing factor, though to a lesser extent. A 10% increase in SWD enrollment is associated with a 0.11-point decrease in letter grade.
Race and Economics Are Closely Linked
Schools with higher percentages of Black, Hispanic, and Native American students tend to have lower grades. However, when controlling for economic disadvantage, racial composition becomes a less significant predictor. This suggests that economic factors, rather than race itself, drive these disparities.
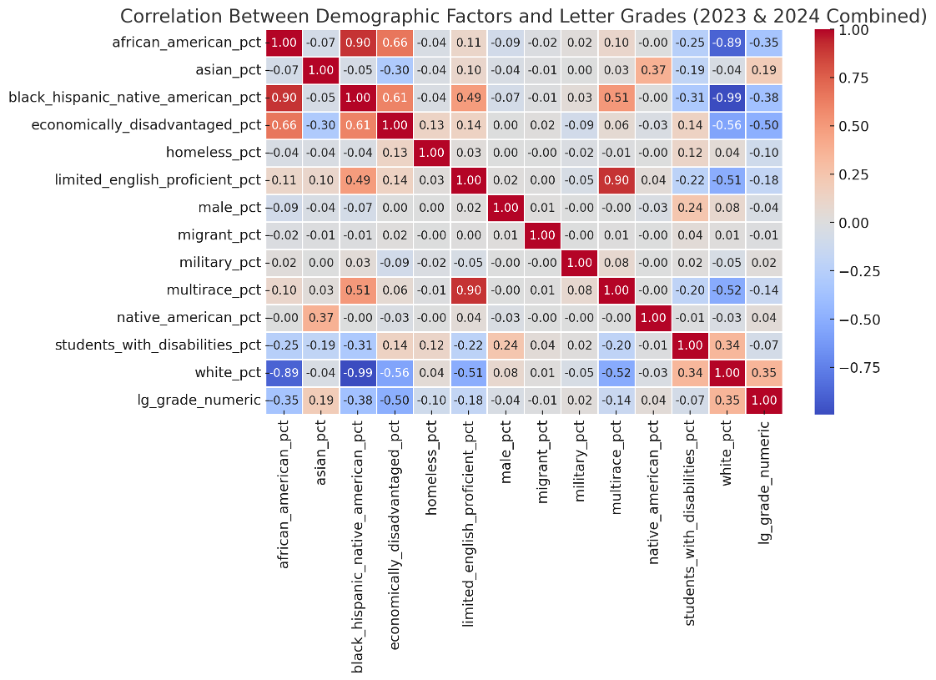
See the correlation matrix below:
Demographics Explain About One-Third of Grade Variation
The updated linear regression model explains 29% of the variance in school letter grades, meaning that while demographics play a measurable role, other factors—such as instructional quality, funding, and school leadership—are also crucial.
What If Demographics Were Removed?
A simulated model scenario where a school had no economically disadvantaged students and no SWDs predicted an average letter grade of 4.5 (A range). This reinforces the idea that many low-performing schools face structural challenges beyond their control.
In the context of Tennessee’s voucher era, public schools operate under significantly different—and often more challenging—conditions than private schools, making their achievements all the more remarkable. The assumption that private schools inherently provide a superior education doesn’t hold up under scrutiny.
Unlike private institutions, which can be selective in their admissions, public schools serve every student—regardless of economic status, disability, or other challenges. Private schools often have the luxury of limiting enrollment to students who fit their preferred criteria, while public schools are tasked with educating all children who walk through their doors—often with fewer resources and greater accountability.
Despite these challenges, many public schools deliver exceptional outcomes. Educators work tirelessly to support students from diverse backgrounds, implementing innovative instructional strategies and targeted interventions to ensure student success. Their ability to foster academic achievement and social growth, even in the face of structural obstacles, speaks to the public education system's resilience, dedication, and effectiveness.
Public schools should be celebrated rather than maligned for their role in serving all students, strengthening communities, and proving that educational excellence is not exclusive to selective institutions.
This blog post was proofread with suggested corrections by Grammarly.
In my previous blog, I provided a detailed breakdown of the TN Letter Grades. In this post, I want to shift focus and highlight the schools that stand out as outliers, defying the norms. We’ll not only look at the schools that achieved perfect scores on their TN Letter Grades—excelling in Achievement, Growth, Growth 25, and College and Career Readiness (for high schools)—but also examine schools with high percentages of Economically Disadvantaged (ED) students, Students with Disabilities (SWD), and Black, Hispanic, and Native American (BHN) students that still managed to earn an “A.”
Oak Ridge: Willow Brook Elementary
Blount County: Carpenters Elementary School
Maryville: John Sevier Elementary
Carter County: Little Milligan
Elizabethton: West Side Elementary
Cheatham County: Kingston Springs Elementary
Cocke County: Grassy Fork Elementary
Metro Nashville Public Schools: Meigs Middle
Metro Nashville Public Schools: Valor Flagship Academy
Metro Nashville Public Schools: Valor Voyager Academy
Decatur County: Decaturville Elementary
Dickson County: Stuart Burns Elementary
Dickson County: Centennial Elementary
Gibson Co Sp Dist: South Gibson County Elementary School
Greeneville: Tusculum View Elementary
Hamilton County: Daisy Elementary School
Hamilton County: McConnell Elementary School
Hamilton County: Thrasher Elementary School
Hawkins County: Mt Carmel Elementary
Humphreys County: Waverly Elementary
Knox County: Blue Grass Elementary
Knox County: A L Lotts Elementary
Knox County: Farragut Intermediate
Knox County: Shannondale Elementary
Loudon County: Highland Park Elementary
McNairy County: Selmer Elementary
Madison County: Community Montessori School
Madison County: South Elementary
Marion County: Whitwell Middle School
Montgomery County: Sango Elementary
Rhea County: Frazier Elementary
Rutherford County: Buchanan Elementary
Rutherford County: Christiana Elementary
Rutherford County: Eagleville School
Rutherford County: Lascassas Elementary
Rutherford County: Thurman Francis Arts Academy/Magnet School for the Arts
Rutherford County: Walter Hill Elementary
Rutherford County: Wilson Elementary School
Rutherford County: Stewartsboro Elementary
Rutherford County: Stewarts Creek Elementary School
Collierville: Tara Oaks Elementary School
Germantown: Dogwood Elementary School
Lakeland: Lakeland Elementary School
Bristol: Holston View Elementary
Kingsport: Thomas Jefferson Elementary School
Kingsport: Andrew Johnson Elementary School
Sumner County: Bethpage Elementary
Sumner County: Howard Elementary
Sumner County: Liberty Creek Elementary
Sumner County: Oakmont Elementary
Sumner County: Clyde Riggs Elementary
Sumner County: Union Elementary School
Johnson City: Lake Ridge Elementary
Johnson City: South Side Elementary
Williamson County: Creekside Elementary School
Williamson County: Trinity Elementary
Wilson County: Lakeview Elementary School
Wilson County: Rutland Elementary
Oak Ridge: Oak Ridge High School
Metro Nashville Public Schools: Hume - Fogg High
Metro Nashville Public Schools: Martin Luther King Jr School
Metro Nashville Public Schools: Valor Flagship Academy
Greeneville: Greeneville High School
Hamilton County: Chattanooga High School Center for Creative Arts
Hamilton County: Chattanooga School for the Arts and Sciences Upper
Hamilton County: East Hamilton High School
Hamilton County: Hamilton County Collegiate High at Chattanooga State
Hamilton County: STEM School Chattanooga
Knox County: L N STEM Academy
Madison County: Jackson Central-Merry Early College High
Madison County: Madison Academic Magnet High School
Rutherford County: Central Magnet School
Rutherford County: Eagleville School
Memphis-Shelby County Schools: Medical District High School
Memphis-Shelby County Schools: East High
Memphis-Shelby County Schools: Middle College High
Memphis-Shelby County Schools: University High School
Memphis-Shelby County Schools: White Station High
Memphis-Shelby County Schools: Whitehaven High
Arlington: Arlington High
Bartlett: Bartlett High School
Collierville: Collierville High School
Williamson County: Franklin High School
Williamson County: Independence High School
Williamson County: Nolensville High School
Williamson County: Ravenwood High School
Wilson County: Green Hill High School
Tennessee Public Charter School Commission: KIPP Antioch Global High School
For 2023-2024 students, the average percentage of ED students in F schools was 49.64%. Using that as a benchmark, here are the schools that earned an A with ED percentage of 50% or higher.
Putnam County: Burks Elementary (66%)
Memphis-Shelby County Schools: Delano Elementary (63%)
Putnam County: Northeast Elementary (58%)
Memphis-Shelby County Schools: Leadership Preparatory Charter School (58%)
Memphis-Shelby County Schools: Newberry Elementary (55%)
For 2023-2024 students, the average percentage of BHN students in F schools was 82.2%. Using that as a benchmark, here are the schools that earned an A with a BHN percentage of 83% or higher:
Memphis-Shelby County Schools: Medical District High School (97.5%)
Memphis-Shelby County Schools: Southwind Elementary (94.0%)
Memphis-Shelby County Schools: Delano Elementary (97.5%)
Memphis-Shelby County Schools: East High (85.0%)
Memphis-Shelby County Schools: Middle College High (97.5%)
For 2023-2024 students, the average percentage of SWD students in F schools was 15.96%. Using this as a benchmark, here are the schools that earned an A with an SWD percentage of 16% or higher:
Anderson County: Grand Oaks Elementary (25%)
Clinton: North Clinton Elementary (31%)
Oak Ridge: Willow Brook Elementary (22%)
Bedford County: Cascade Elementary (16%)
Blount County: Carpenters Elementary School (18%)
Putnam County: Burks Elementary (66%)
Memphis-Shelby County Schools: Delano Elementary (63%)
Putnam County: Northeast Elementary (58%)
Memphis-Shelby County Schools: Leadership Preparatory Charter School (58%)
Memphis-Shelby County Schools: Newberry Elementary (55%)
The impact of school letter grades on schools, school leaders, teachers, and students has largely unfolded as anticipated. It's not just a coincidence that letter grade legislation often serves as a catalyst for voucher programs across numerous states. By simplifying school accountability into easily digestible grades, we risk oversimplifying a complex system that even experts grapple with. We must urge a more comprehensive understanding of educational quality that goes beyond mere letters, ensuring that real progress is made for our students and educators alike.
To understand how the computation of these letter grades affects schools, I took a preliminary look last year at the grade distribution. The improvement of achievement percentages is fundamental to federal accountability, but it has been entirely removed from these state letter grades.
In the second year, I was confident we would witness significant improvements. Given the wealth of experience that many educators possess, having navigated through the complexities of school accountability, I believe we would have effectively deciphered the strategies needed to enhance our performance and elevate those letter grades.
Let’s compare the two years.
Data Sources
2024 School-Level Profile Data
Out of the 1,905 schools listed for letter grades in Tennessee, 215 schools (11.29%) were ineligible to receive a grade. These schools were excluded from the analysis to focus on the distribution of grades among eligible schools. This is similar to 2022-2023 where 210 out of 1900 schools were ineligible. To see how this is determined, you can visit the TN DOE Webpage on letter grades here.
Distribution
In 2023-2024, the letter grades were distributed as follows:
A: 320 (17%)
B: 450 (24%)
C: 500 (27%)
D: 330 (18%)
F: 80 (4%)
Compared to 2022-2023, the distribution has shifted, highlighting some key trends:
Increase in A Grades:
The percentage of schools receiving an A increased slightly from 17% to 17% (294 to 320 schools).
Slight Decline in C Grades:
C grades decreased from 30% (513 schools) to 27% (500 schools), with schools likely moving into higher or lower grade categories.
Reduction in D and F Grades:
D grades fell from 21% (350 schools) to 18% (330 schools), and F grades dropped from 5% (92 schools) to 4% (80 schools). This is a positive trend, suggesting fewer schools are struggling at the lowest levels.
This year's distribution continues to resemble a normal curve, with a slight skew toward A grades. While last year, 77% of schools fell into the B, C, or D categories, this year that number has dropped slightly to 75%, reflecting improvements at both the top and bottom of the grading scale.

Generated by ChatGPT
The comparison of average scores across metrics provides insight into how schools in Tennessee have performed over the past two years. Here’s a breakdown of the trends by letter grade:
2022-2023:
A: 4.85 | B: 3.95 | C: 2.96 | D: 2.00 | F: 1.02
2023-2024:
A: 4.84 | B: 3.99 | C: 3.04 | D: 2.06 | F: 1.05
Key Changes:
Grades B and C saw slight improvements, with C grades showing a noticeable increase from 2.96 to 3.04.
Grades A, D, and F remained relatively stable, with minor differences that do not indicate significant shifts.
2022-2023:
A: 4.96 | B: 3.92 | C: 2.80 | D: 1.62 | F: 1.00
2023-2024:
A: 4.92 | B: 3.82 | C: 2.73 | D: 1.60 | F: 1.03
Key Changes:
A Grades dropped slightly from 4.96 to 4.92, although they remain well above the threshold for full growth points.
Grades B and C also saw modest declines, while F Grades slightly improved from 1.00 to 1.03.
2022-2023:
A: 4.45 | B: 3.58 | C: 3.10 | D: 2.64 | F: 3.21
2023-2024:
A: 4.40 | B: 3.54 | C: 2.99 | D: 2.64 | F: 2.69
Key Changes:
F Grades dropped from 3.21 to 2.69, reflecting a notable decrease in the lowest-performing schools' progress for students in the bottom quartile.
Grades A, B, and C showed small decreases, while D Grades remained unchanged at 2.64.
Grade A:
Continues to represent the highest levels of achievement and growth. However, small declines in both growth and growth25 scores may warrant further investigation into sustaining top-tier performance.
Grade B:
Slight improvements in achievement but minor decreases in growth and growth25 suggest consistent performance with room for growth.
Grade C:
The improvement in achievement (from 2.96 to 3.04) is encouraging, though declines in growth and growth25 could indicate challenges in maintaining momentum.
Grade D:
Minimal changes across metrics show stability but limited progress in improving scores.
Grade F:
While achievement scores improved slightly (1.02 to 1.05), the sharp decline in growth25 (3.21 to 2.69) highlights ongoing difficulties in addressing the needs of the lowest-performing students.
Subgroup Performance
One of the most revealing pieces of data from 2022-2023 was the high percentage of economically disadvantaged (ED) and Black/Hispanic/Native American (BHN) students in F schools. I wondered if that trend would stay the same or change, and for ED students, it has improved.

Generated by ChatGPT
Increase in Economic Disadvantage for Higher Grades:
Schools with an A grade saw an increase from 18.34% (2022-2023) to 22.27% (2023-2024) in economically disadvantaged students. This suggests a positive trend toward equity in top-performing schools.
Slight Increase for B and C Grades:
B grades rose from 28.92% to 31.10%, and C grades increased from 36.49% to 38.90%. These shifts indicate a growing representation of disadvantaged students in mid-tier schools.
Reduction in D and F Grades:
The percentage of disadvantaged students in D grades dropped from 41.97% to 45.93%. Similarly, F grades saw a reduction from 54.52% to 49.64%.
This may reflect targeted interventions or progress in struggling schools.
This trend is further reflected in the correlation between the percentage of economically disadvantaged students and letter grade scores. In 2022-2023, the correlation was -0.50, while in 2023-2024, it decreased slightly to -0.44. Although still significantly negative, the weaker correlation suggests a modest reduction in the impact of economic disadvantage on school performance.
BHN Improvement
One of the most disturbing and glaring trends from 2022-2023 was the high percentage of BHN students in F schools. This has improved dramatically in 2023-2024. Here is a comparison graph.

Generated by ChatGPT
Increases in A and B Grades:
BHN representation in A-grade schools increased significantly from 21.82% to 35.79%.
B-grade schools also saw a large jump from 27.74% to 48.72%, reflecting positive strides toward equity in higher-performing schools.
Consistent Growth Across Grades:
BHN percentages rose steadily across all letter grades, with C and D schools showing increases of ~20 percentage points each.
Marginal Change in F Grades:
BHN representation in F-grade schools increased slightly from 80.05% to 82.20%, indicating persistent challenges for the most disadvantaged schools.
The Pearson Correlation Coefficient between BHN student percentages and letter grade scores remained virtually unchanged, increasing slightly from -0.37 in 2022-2023 to -0.39 in 2023-2024.
Students with Disabilities Populations
The impact of Students with Disabilities (SWD) on letter grades felt counter-intuitive in 2022-2023. Schools with A and F grades had nearly identical percentages of SWD students, raising questions about how disability representation aligns with school performance metrics. In 2023-2024, this pattern shifted slightly, with SWD representation increasing across all letter grades.
Notably, the largest growth occurred in F-grade schools, where SWD percentages rose from 12.24% in 2022-2023 to 15.96% in 2023-2024. This sharp rise highlights a growing concentration of SWD students in the lowest-performing schools, emphasizing systemic challenges that disproportionately affect these populations.
Meanwhile, higher-performing schools also experienced modest increases in SWD percentages, with A-grade schools rising from 12.87% to 13.53%. Despite these gains, the gap between high- and low-performing schools widened, underscoring the need for equity-driven interventions to support SWD students more effectively.
This evolving dynamic invites further exploration into the role of SWD representation in shaping school letter grades and how policies can better address the unique challenges faced by these students.

Generated by ChatGPT
The Pearson Correlation Coefficient between SWD percentages and letter grade scores remained relatively weak, with a value of -0.13 in 2023-2024, compared to -0.09 in 2022-2023, indicating no significant relationship between the two.
Interestingly, the SWD distribution graph for 2023-2024 more closely resembles the patterns observed in the ED and BHN graphs, aligning with expectations and suggesting potential connections between these demographics and school performance metrics.
Conclusions
Schools in the state performed better in 2023-2024 on their school letter grades than they did in 2022-2023. The percentage of ED, BHN, and SWD students increased, reflecting a positive shift toward greater inclusion and representation across various demographics. However, disparities persist, particularly in the correlation between economic disadvantage and letter grades, as well as the overrepresentation of BHN and SWD students in lower-performing schools.
While the overall improvement in letter grades is encouraging, these results underscore the need for targeted interventions and support for schools serving disadvantaged populations. Policies should focus on addressing systemic inequities to ensure all students, regardless of background, have access to the resources and opportunities needed to succeed.
Future analyses should continue monitoring these trends to assess the long-term impact of accountability measures and demographic shifts on educational equity and performance.
AI Disclaimer
I used ChatGPT to generate comparative bar charts since I had them in two different Jupyter Notebooks. It was easier to send screenshots of them and have it create new ones. I also used ChatGPT to clean up my writing and formatting.
I only have a few weeks left in Campbell County, and I wanted to reflect on it. I want to write about the improvements that we have made since I’ve been here. In district supervisor positions, you’re always on a continuum of change and improvement. The truth is the job is never finished.
The other truth is that you never do this job alone. I have been part of one of the strongest teams I can even imagine. So please don’t read this blog that these are my accomplishments. I’ve only been fortunate to have been part of them.
It is a team effort that is led by the Director of Schools. If you don’t have a strong Director, then it is tough to get anything accomplished. In this situation, I had a very strong Director in Ms. Fields who pushed all of us to balance improvement while considering the already strenuous workload on teachers, principals, and students. Ms. Fields also reminded us regularly not to forget what it’s like to be in a classroom and to lead a school. She encouraged us to be empathetic to our people but to have high standards for our outcomes. This balance is what has allowed all of us to be successful.
In no order of importance, I thought I would reflect on some of the accomplishments that come to mind.
Collaborative Conferencing
Being involved in PECCA was a great experience. It really put me in touch with the past, present, and future of Campbell County. When I initially came on the Administration Team, there were a lot of employee organization leaders who had been involved in Collective Bargaining prior to 2011. I remember these folks and their work, and I noticed the MOU felt more like the Collective Bargaining Agreement than an MOU.
Something else that became obvious to me is that most teachers had no idea that they had an MOU and that they had all of these people working on it. It is hours of work after hours for which no one is getting paid anything extra. It is truly a labor of love, and for employee organizations, it is the most direct form of advocacy that they have.
While I agreed with most of what was there, there were some glaring loopholes that needed to be closed. For example, the MOU originally read that a teacher could take up to 20 consecutive days of unpaid leave before they were put on unpaid leave by the Director of Schools. This meant that a teacher could take 19.5 days off, come back for half a day, and then take 19.5 days off again. This means a teacher could keep their position while only showing up for 8 days a school year. It wasn’t until this was being discussed that I saw an employee test these waters, but we finally changed it.
The section on unpaid leave is now more in line with policy and procedures. It states, “To prevent being placed on automatic leave, in cases where the teacher cannot apply for leave under the Family Medical Leave Act, the teacher must provide documentation to the Director of Schools to justify their unpaid leave. “This was a lot of work and discussion by the PECCA Members from both the Admin Team and the Teacher Team. I consider it a huge accomplishment that we got this done, and even added a definition of sick leave which was completely missing.
Let me be even more emphatic about it: there was no sick leave policy for certified employees at all. This is why it was being abused and people had an entitled attitude about “their days.” These days technically belong to the state which is why you get to transfer them from system to system, and the state is very clear about how they are to be used. Scanning other systems’ policies for sick leave showed just how restrictive they were elsewhere, and I felt like I was spinning my wheels trying to solve Chronic Student Absenteeism when I couldn’t solve Chronic Teacher Absenteeism.
It is very satisfying to look back on that work to see that everyone in the group saw that this wasn’t a tenable situation for a school system that wanted to be whole and healthy. At our best, we had everyone working together. There were some long evenings and not everyone saw eye-to-eye, but in the end, we got things done, and I will always be proud of that.
Test Scores
To be clear, the test scores always belong to the students. After all, they’re the ones who take the tests. Even though this is true, test scores are the backbone of school accountability, and even though that changed dramatically with the school letter grades, we’ve been getting school report cards for a long time.
For those who aren’t in education, there are two ways to look at your progress in test scores. One way is called “Achievement” and the other way is called “Growth.” Achievement is the percentage of students who score “proficient” on the TCAP or EOC. Growth is a complex measure that predicts what a student’s test score should be, and then whether it is above that or below it, it is considered positive or negative growth. When put all of that together, you get a teacher’s growth, a school’s growth, and so on.
In Campbell County, our Achievement has improved every single year. As you can see from this School Board Data Presentation, it has improved every year.
District Achievement Overview
The provided charts illustrate the trends in district achievement over time, specifically focusing on the growth in English Language Arts (ELA) and Math across different grade levels: elementary (grades 3-5), middle (grades 6-8), and high school (grades 9-12).

District Achievement Over Time
Grades 3-5: Achievement increased from 23 in 2020-2021 to 34 in 2022-2023, indicating an 11-point growth.
Grades 6-8: Achievement rose from 17.5 in 2020-2021 to 25 in 2022-2023, marking a 7.5-point growth.
Grades 9-12: Achievement saw a significant rise from 14.4 in 2020-2021 to 26.8 in 2022-2023, showing a 12.4-point growth.
District-wide Performance in ELA and Math
Overall Trends: Both ELA and Math have shown considerable growth over the years, with notable increases from 2021 to 2023.
ELA: Increased from 21.6 in 2017 to 28.4 in 2023.
Math: Grew from 17.7 in 2017 to 24.6 in 2023.

Elementary School Performance
ELA: The performance has steadily increased, reaching 34 in 2023 from 22 in 2017.
Math: Similarly, Math performance rose to 33 in 2023 from 22 in 2017.

Middle School Performance
ELA: After a drop in 2021, ELA performance rebounded to 22 in 2023, slightly below the 2019 peak of 25.
Math: Following a dip in 2021, Math performance recovered, reaching 27 in 2023, just shy of the 2019 peak of 31.

High School Performance
ELA: High school ELA performance has shown significant improvement, reaching 28 in 2023, up from 21 in 2017.
Math: Despite some fluctuations, Math performance improved to 12 in 2023 from a low of 5 in 2018.

Comparative Insights
Elementary School Improvement:
Both ELA and Math have shown consistent improvement, suggesting effective early education strategies. The continuous rise in performance indicates a solid foundation being built at this level.
Middle School Improvement:
ELA and Math faced a dip in 2021, likely due to disruptions caused by external factors (e.g., the pandemic). However, the rebound in 2022 and 2023 suggests recovery efforts are taking effect, though there's room for improvement to reach or exceed past peaks.
High School Improvement:
ELA shows a marked improvement, indicating effective teaching strategies and student engagement at the high school level. Math, while improving, shows more variability, highlighting the need for targeted interventions to sustain and further this growth
Growth
Growth tells a different story than achievement. While many of our students are performing better than they were in 2017, the overall district growth decreased from a level 3 to a level 1 in 2023. The reason for this is because of so many large negative growth scores. This suggests that students are not performing their best on the test. Given their benchmarking scores suggest they are capable of performing better than they did, it suggests that students are just not trying on the TCAP and EOC tests. We are putting in a lot of programs to make that happen.
Here are high school growth levels over the past three years:

The analysis of high school growth indices for the subjects Algebra I, Algebra II, English I, English II, and Geometry over the years 2021 to 2023 reveals several trends and insights.
Algebra I:
The Growth Index shows a positive trend initially, peaking in 2022. However, there is a noticeable decline in 2023, bringing the index closer to its 2021 level. This suggests that while there was initial improvement, the gains were not sustained.
Algebra II:
Similar to Algebra I, Algebra II also experienced an upward trend, peaking in 2022 before a significant decline in 2023. This indicates a potential issue in maintaining growth in Algebra II over the long term.
English I:
The Growth Index for English I shows an initial increase, peaking in 2022, followed by a decline in 2023. Despite the fluctuation, the overall trend suggests a need for focused strategies to sustain and improve growth.
English II:
English II demonstrates a consistent decline in the Growth Index from 2021 to 2023. This steady decrease highlights the need for interventions and targeted support to reverse the downward trend.
Geometry:
Geometry shows a positive and continuous increase in the Growth Index from 2021 to 2023, indicating successful strategies and improvements in teaching and learning practices in this subject.
Overall, the high school data reflects a mixed performance with notable areas for improvement, especially in maintaining growth in Algebra I, Algebra II, and English I, and reversing the decline in English II. The positive trend in Geometry is encouraging and may serve as a model for other subjects.
Here are growth rates for Math and ELA in Grades 3-8:

Subjects: English Language Arts (ELA) and Math
The analysis of growth indices for English Language Arts (ELA) and Math for grades 4-8 over the years 2021 to 2023 provides insights into student performance and areas needing attention.
English Language Arts (ELA):
Grade 4: The Growth Index for ELA in Grade 4 remained relatively stable, indicating consistent performance without significant fluctuations.
Grade 5: The Growth Index shows minor fluctuations but remains generally stable, suggesting a need for sustained support to drive further improvement.
Grade 6: There is a steady decline in the Growth Index from 2021 to 2023, indicating challenges in maintaining growth and highlighting the need for targeted interventions.
Grade 7: The trend shows a slight decline, calling for strategies to enhance growth and support students in this grade.
Grade 8: The Growth Index shows a consistent decline, indicating significant challenges and a need for robust interventions to reverse the trend.
Math:
Grade 4: Math shows a stable but slightly declining trend, emphasizing the need for continuous support.
Grade 5: The Growth Index for Math displays a declining trend, suggesting areas needing improvement.
Grade 6: Similar to ELA, the Math Growth Index shows a decline, pointing to a need for targeted efforts to boost performance.
Grade 7: The trend shows a decrease, indicating challenges in maintaining growth.
Grade 8: The Growth Index shows fluctuations, with a decline from 2022 to 2023, indicating areas needing attention and support.
Overall, the data for grades 4-8 highlights the need for sustained efforts to improve and maintain growth in both ELA and Math. While some grades show stability, others indicate significant areas for improvement, particularly in grades 6-8. Focused interventions and continuous support are essential to reverse declining trends and enhance overall student performance in these critical subjects.
One of the biggest changes we’ve made is the transparency with data. When I came on board, I was told that AMOs (Annual Measurable Objectives) were handed out on a sticky note. I was also told that they would present whatever they wanted about data before the board. While testing accountability wasn’t as hot and heavy as it now, they still had the same numbers to give the board.
Ultimately, more students are performing better on their state tests, and that is good news for the students in Campbell County. This is a group effort from students, teachers, principals, and central office administrators.
ACT
Campbell County improved its ACT average from 16.6 in 2020-2021 to 17.3 in 2022-2023. Also, the county the most students with an ACT over 21 in its history in 2022-2023. Also the participation rate for ACT is 99%. It had fallen below 95% in 2017-2018.
Ready Graduate
The percentage of Ready Graduates has increased from 26.5% in 2017-2018 to 40.1% in 2023-2024.
CTE Concentrators
The percentage of CTE Concentrators improved from 36.5 in 2017-2018 to 54.3% in 2022-2023.
PostSecondary Going Rates
Pre-Pandemic Growth:
The district saw a steady increase in postsecondary enrollment rates from 2016-2017 to 2018-2019, peaking at 57.3%. This suggests effective strategies and strong support systems were in place to encourage students to pursue higher education.
Impact of COVID-19:
The 2019-2020 and 2020-2021 academic years saw a decline in enrollment rates, dropping to 47.3% and 46.9%, respectively. The disruptions caused by the pandemic likely played a significant role in this decline. These years highlight the challenges faced by students and the need for adaptive strategies during crises.
Post-Pandemic Recovery:
The increase to 51.8% in 2021-2022 indicates a positive recovery trend. This suggests that the district's efforts to support students in the aftermath of the pandemic are beginning to take effect.
Processes
There have been so many processes that have improved since 2018. It is impossible to list them all, but here are the ones that come to mind. Again, these are all group efforts.
· A comprehensive VOIP telephone system for the entire county.
· A modern website with an app.
· A robocall system for absences and emergencies.
· Upgraded technology for every school.
· A Facebook page for the district and every school.
· Teacher of the Year recognition
· An online application and HR system
· Compliance with the new counselor standards
· Updated 504 procedures
· Enrollment Dashboarding
· Conduct Data Collection
· A Tiered System for Truancy
· Data and Accountability updates for principals
· Weekly TEAM reports
· Ayers training for Academic Coaches
· Regular meetings for Academic Coaches
· A leadership academy for teachers.
· A process for awarding and tracking tenure.
· A solid chain of command structure.
· McREL Training
· SREB Training
· Interventionist Positions
· Increased AP and Dual Enrollment participation
· Vans for CTE and for Homeless student transportation
· Ayers Scholars Program
· FAFSA Frenzy
· Turf fields at both high schools (JHS is currently being planned.).
· We trained over 250 substitute teachers while I was there.
· We built an online platform during COVID.
· We had some of the fewest COVID closures in the state.