
The Tennessee Department of Education released the 2024-25 school letter grades on December 18, 2024. This is the third year of letter grades under the revamped formula that emphasizes academic achievement over growth. In this post, I continue my analysis of these letter grades, examining distribution trends, demographic correlations, and standout schools.
Data Sources
The data files used for this analysis are available from the Tennessee Department of Education's data downloads page. I merged the 2024-25 Letter Grade File with the 2024-25 School Profile data to examine demographic patterns.
Out of 1,905 schools listed for letter grades, 208 (10.9%) were ineligible to receive a grade. These schools were excluded from this analysis, leaving 1,697 eligible schools.
Distribution
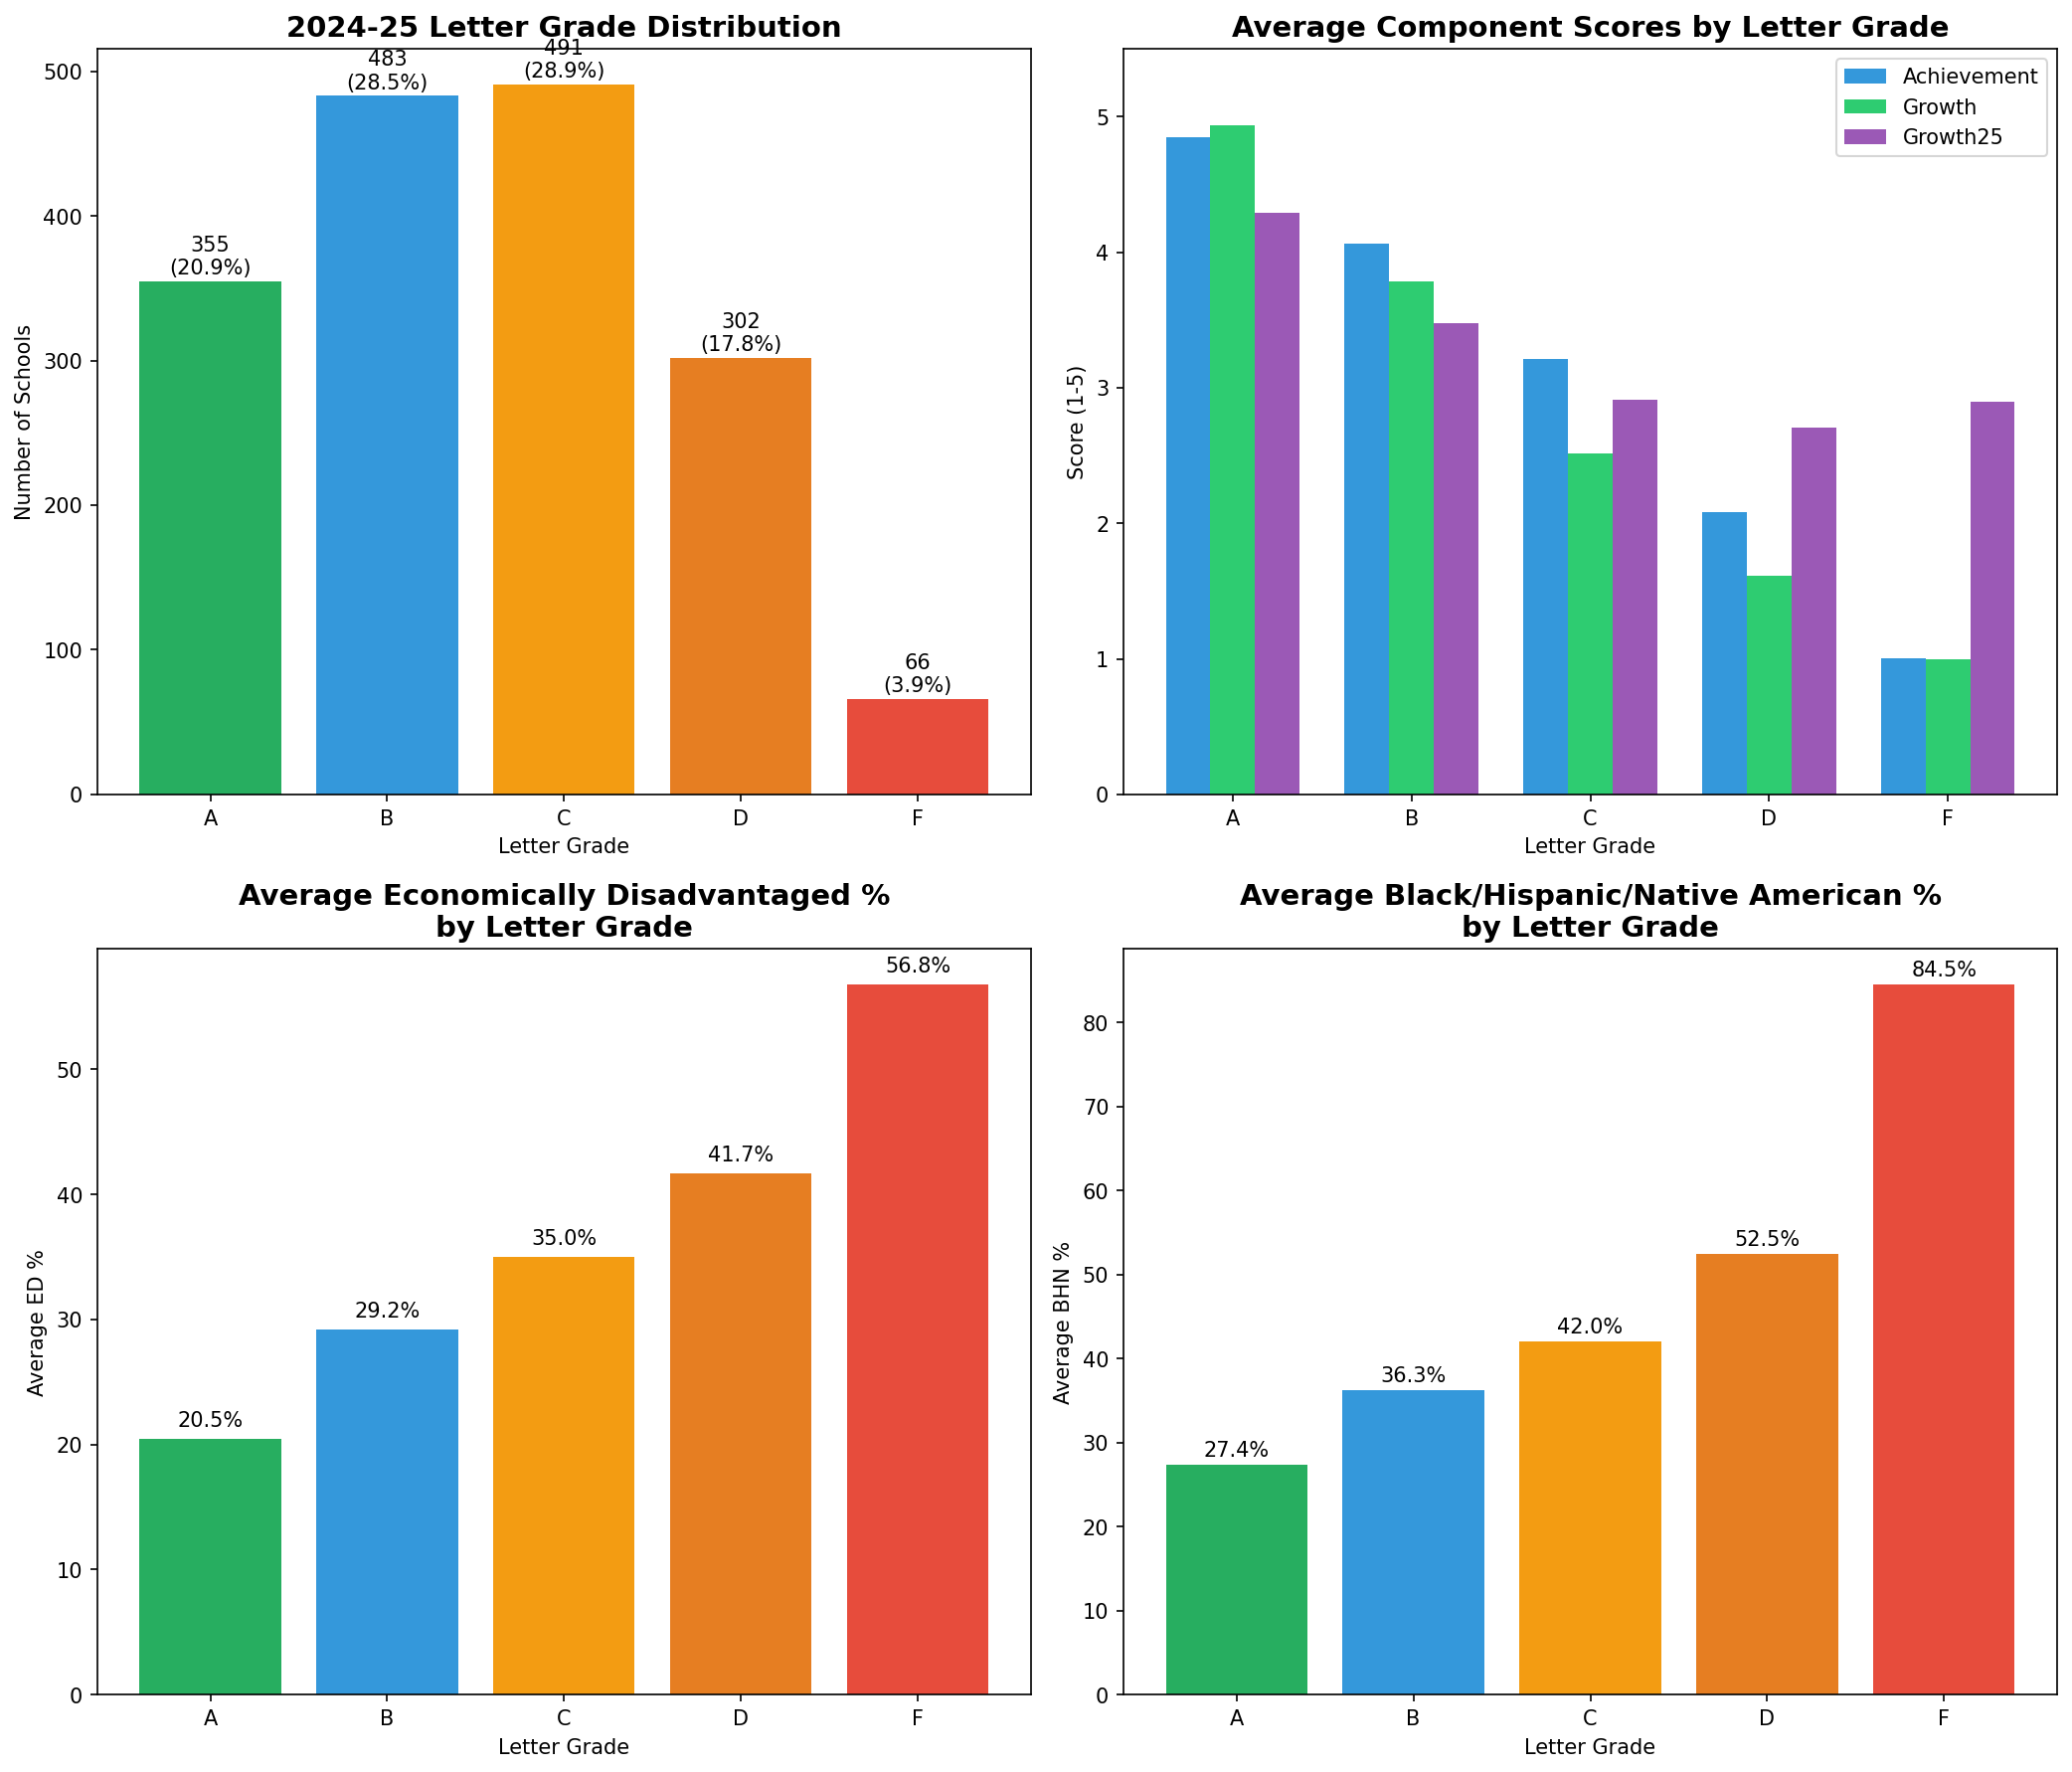
The 2024-25 letter grades were distributed as follows:
A: 355 (20.9%)
B: 483 (28.5%)
C: 491 (28.9%)
D: 302 (17.8%)
F: 66 (3.9%)
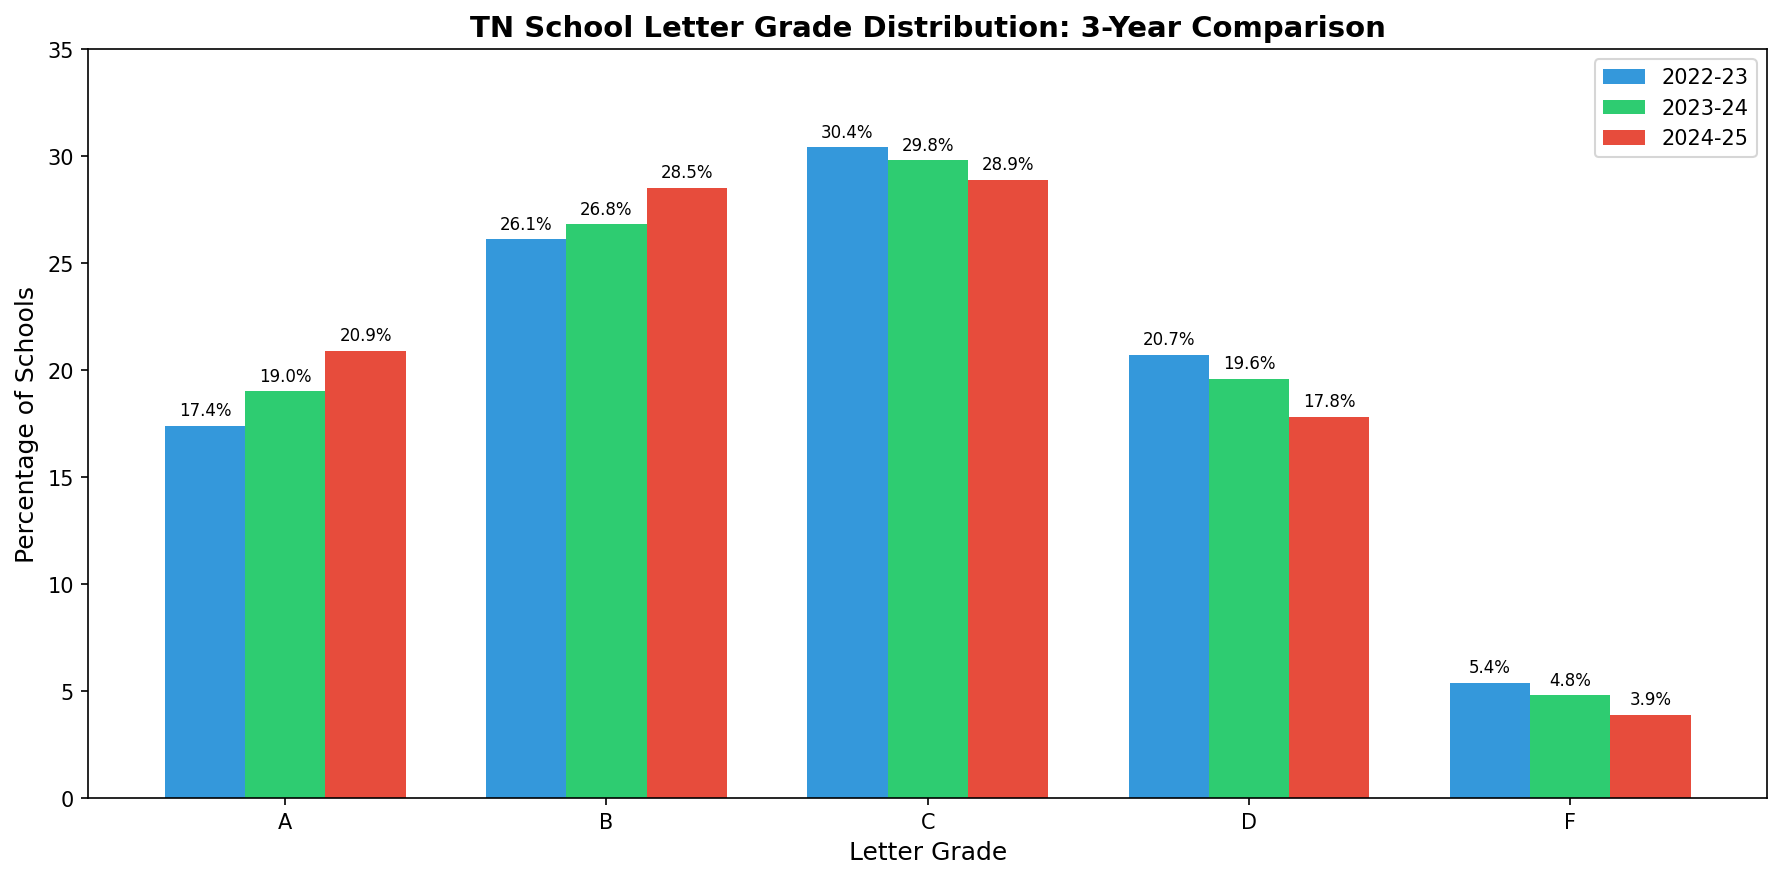
This continues the positive trend we've seen over the past three years. The percentage of A schools has increased from 17.4% in 2022-23 to 20.9% in 2024-25, while F schools have decreased from 5.4% to 3.9%.
Distribution Comparison
Year-Over-Year Comparison
| Grade | 2022-23 | 2023-24 | 2024-25 | 3-Year Change |
|---|---|---|---|---|
| A | 17.4% | 19.0% | 20.9% | +3.5% |
| B | 26.1% | 26.8% | 28.5% | +2.4% |
| C | 30.4% | 29.8% | 28.9% | -1.5% |
| D | 20.7% | 19.6% | 17.8% | -2.9% |
| F | 5.4% | 4.8% | 3.9% | -1.5% |
The data shows steady improvement: more schools are earning A's and B's while fewer are receiving D's and F's.
What Influences a Grade
Average Scores by Letter Grade
| Grade | Achievement | Growth | Growth25 | Success Rate | LG Score |
|---|---|---|---|---|---|
| A | 4.85 | 4.94 | 4.29 | 58.2% | 4.83 |
| B | 4.06 | 3.78 | 3.47 | 44.5% | 3.91 |
| C | 3.21 | 2.52 | 2.91 | 35.4% | 2.94 |
| D | 2.08 | 1.61 | 2.71 | 23.7% | 2.01 |
| F | 1.00 | 1.00 | 2.90 | 12.5% | 1.18 |
A notable pattern persists from previous years: schools with an F grade actually show higher Growth25 scores (2.90) than D schools (2.71). This metric measures the progress of the lowest-performing 25% of students. While F schools are making gains with their struggling students, this improvement is not sufficiently weighted to improve their overall letter grade.
Summary Dashboard
Subgroup Analysis
The relationship between demographic factors and letter grades remains significant.
Economically Disadvantaged Students
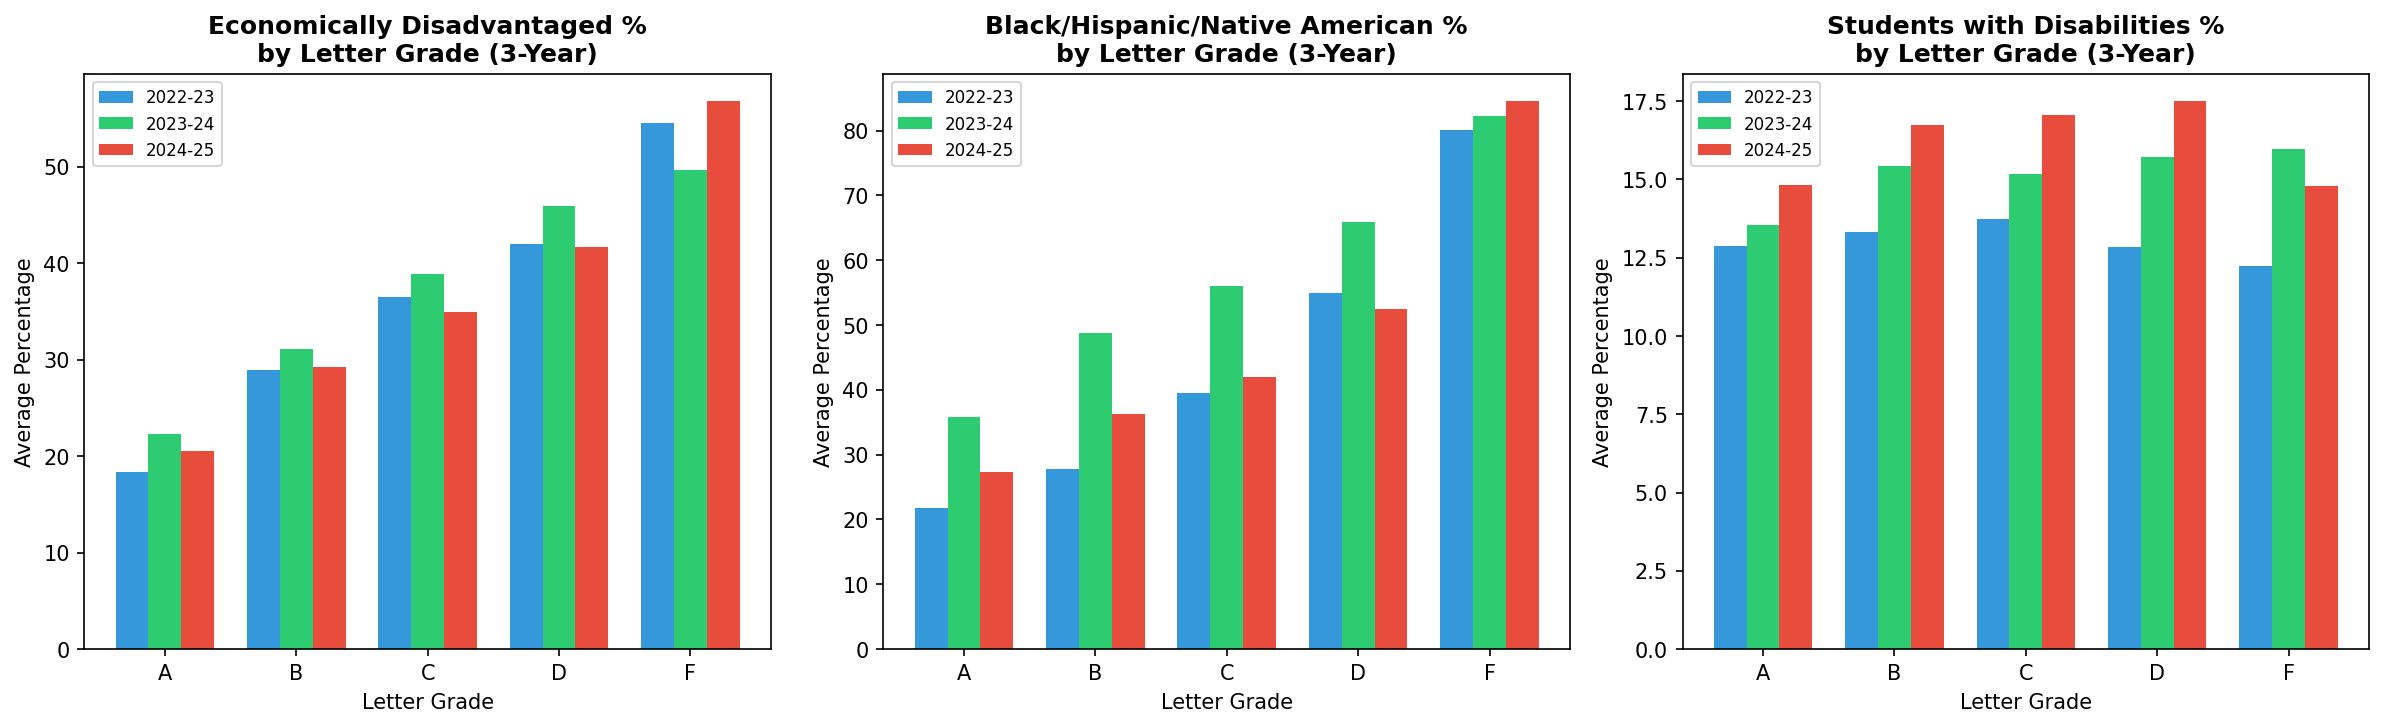
| Grade | 2022-23 | 2023-24 | 2024-25 |
|---|---|---|---|
| A | 18.3% | 22.3% | 20.5% |
| B | 28.9% | 31.1% | 29.2% |
| C | 36.5% | 38.9% | 35.0% |
| D | 42.0% | 45.9% | 41.7% |
| F | 54.5% | 49.6% | 56.8% |
Black, Hispanic, Native American Students
| Grade | 2022-23 | 2023-24 | 2024-25 |
|---|---|---|---|
| A | 21.8% | 35.8% | 27.4% |
| B | 27.7% | 48.7% | 36.3% |
| C | 39.5% | 56.0% | 42.0% |
| D | 55.0% | 65.8% | 52.5% |
| F | 80.1% | 82.2% | 84.5% |
The gap between A schools and F schools remains substantial. A schools average 20.5% economically disadvantaged students compared to 56.8% in F schools. For BHN students, the gap is even more pronounced: 27.4% in A schools versus 84.5% in F schools.
Subgroup Three-Year Comparison
Correlation Analysis
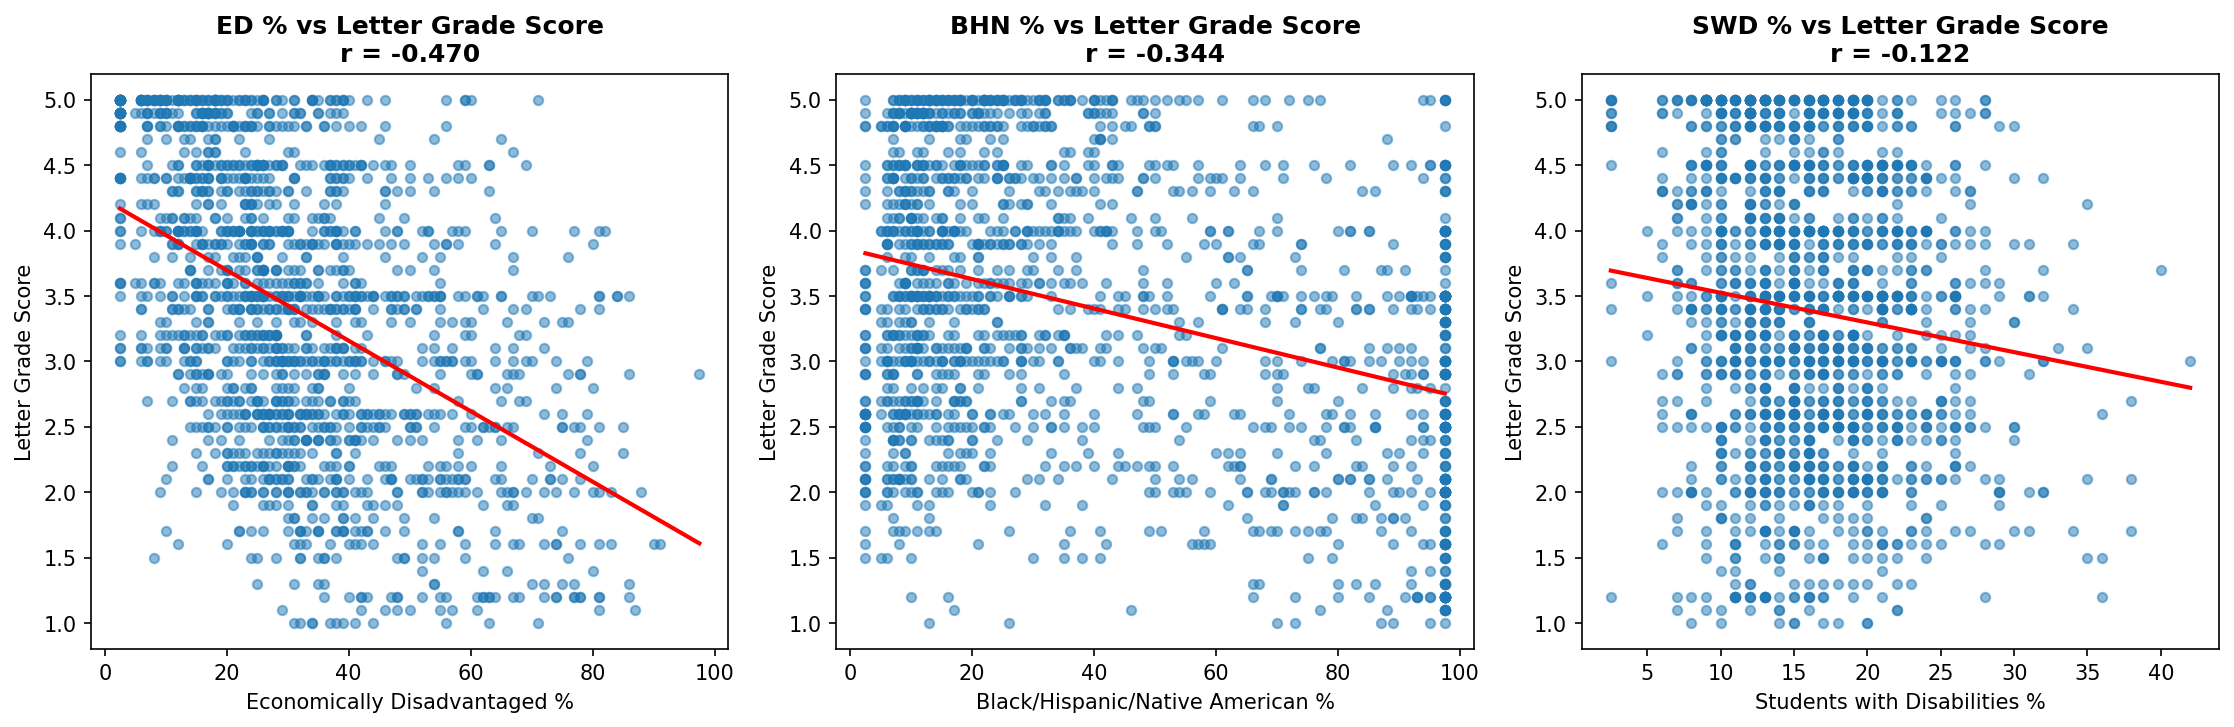
The correlations between demographic factors and letter grade scores show a consistent pattern across all three years:
| Subgroup | 2022-23 | 2023-24 | 2024-25 |
|---|---|---|---|
| Economically Disadvantaged | -0.50 | -0.44 | -0.47 |
| Black/Hispanic/Native American | -0.37 | -0.39 | -0.34 |
| Students with Disabilities | -0.09 | -0.13 | -0.12 |
The correlation between economically disadvantaged percentage and letter grade score (r = -0.47) indicates a moderate negative relationship. Schools with higher percentages of economically disadvantaged students tend to receive lower letter grades.
Correlation Scatterplots
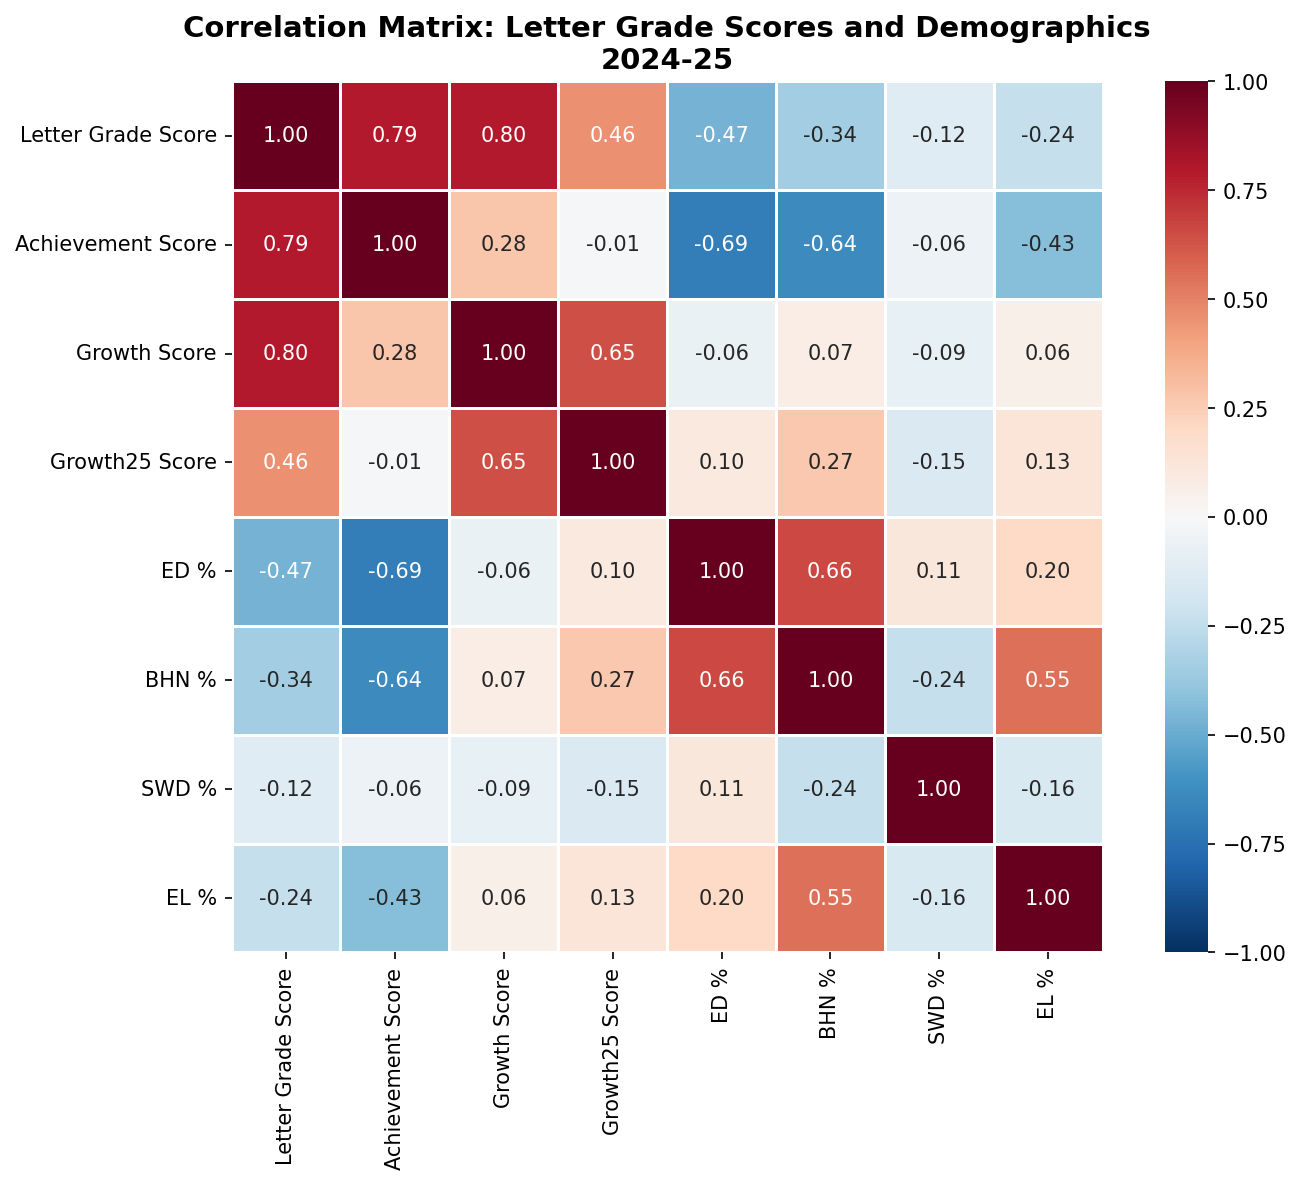
Correlation Heatmap
Conclusions
The 2024-25 letter grades show continued improvement across Tennessee schools. Key findings include:
1. More schools are earning A's (20.9%, up from 17.4% three years ago) and fewer are receiving F's (3.9%, down from 5.4%).
2. The correlation between poverty and letter grades remains strong (r = -0.47), but some high-poverty schools continue to beat the odds.
3. F schools continue to show strong Growth25 scores, meaning they are making progress with their lowest-performing students, but this is not reflected in their overall grades.
The letter grade system continues to simplify complex accountability measures into easily digestible grades. While this provides transparency for families and communities, it's important to remember that these grades are heavily influenced by factors outside of schools' direct control, including poverty and segregation. Schools serving high-need populations face steeper challenges in achieving high letter grades, making the success of many schools all the more remarkable.
Also, it is important to note that many schools in Northeast TN (Johnson, Carter, Unicoi, Greene, and Washington Counties) went through major flooding in the fall, and they worked very hard to just have school, much less show improvement in accountability data.
This analysis used Python with pandas, matplotlib, seaborn, and scipy for data processing and visualization. I used Claude to do the coding and proof my writing.